
Background: The Bollinger Band® indicator was developed by John Bollinger in the 1980s as a specialized adaptation of trading envelopes or bands to gauge how high or low prices are relative to previous prices. Bollinger Bands are based on a moving average – typically, 20 periods – with upper and lower bands two standard deviations above and below the moving average. These bands or parameters should contain about 95% of all price points.
Unlike other envelope-based indicators, however, Bollinger Bands are not constant relative to the moving average but narrow and widen depending on price action and volatility during the moving average period.
Purpose: Bollinger Bands indicate a market’s volatility with just a glance at a chart and can provide significant clues for volatility-based trading strategies, especially for options traders. They are most useful for reading market conditions and determining whether the market is likely to move up, down or sideways.
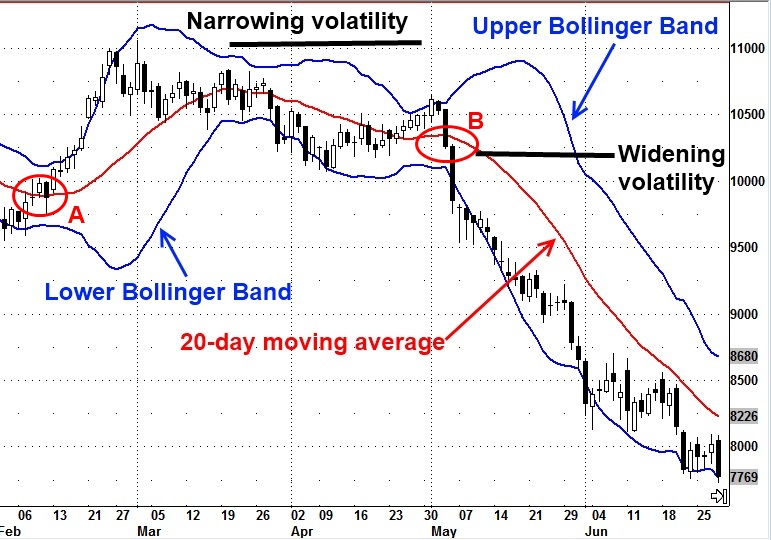
When volatility is rising, the distance between the upper and lower bands will expand; when volatility is low, the distance between the bands contracts. If the distance between the bands becomes unusually wide, it may indicate that the current trend is reaching its end; if the distance between the bands becomes unusually narrow, it may indicate the end of a range-trading period and an imminent breakout.
The levels of the bands can be used to project price targets, or the action of the bands can be used to determine overbought and oversold zones, generally in conjunction with the chart pattern or other indicators to confirm divergences between prices and indicators.
Basic signals: Traders use Bollinger Bands in a number of different ways. Perhaps the simplest involves prices bouncing off the upper or lower band and then crossing the moving average, making the opposite band the price target. When prices come off the lower band and cross above the moving average, it gives a buy signal on the chart below (A). When prices fall from the upper band and drop below the moving average, it is a sell signal (B).
In a strong uptrend, prices tend to stay between the moving average and upper band, in a downtrend, the price action will take place between the lower band and the moving average. If prices drop cross the moving average, it suggests a trend reversal and exiting a position.
Some traders buy when prices touch the lower Bollinger Band and exit when prices reach the moving average, expecting a trading range market. Other traders buy when prices break above the upper Bollinger Band or sell when prices fall below the lower Bollinger Band, expecting the trend to continue.
When Bollinger Bands identify extreme highs or lows in price, the bands or threshold levels can be used in either trend-following or trend-fading strategies, depending on the trader’s approach. The key to a trading decision relates to price action when prices reach the vicinity of the bands or the moving average and whether confirmation is needed from another indicator.
Pro/con: Bollinger Bands provide a good, quick visual reference of market volatility and can be used in many different ways. Traders will need to be clear about their trading style and will need to gain some experience reading and interpreting the bands before making trading decisions.


