
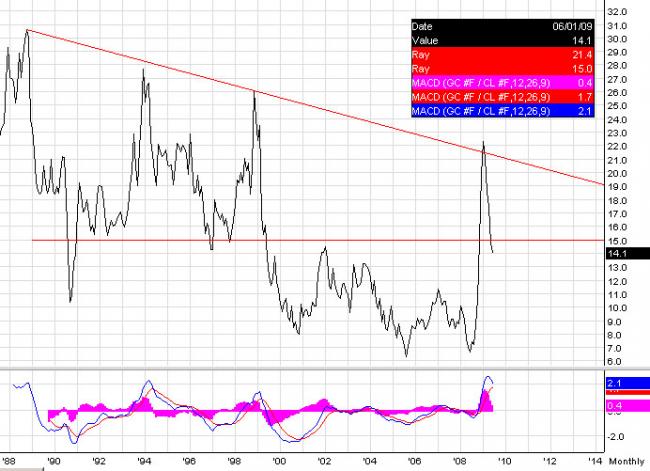
Gold/Crude Oil Continuous Monthly:
Past performance is not indicative of future results.
The Gold/Crude Oil ratio above shows how many contracts of crude oil it takes to buy one contract of gold. Notice after it reached resistance levels from 1989; back on 03/06/09 the ratio neared 22. Then, it took 21.2 contracts of crude oil to buy one contract of gold. This brought the question, “Would we see gold move lower or crude move higher, or neither?” So far, we have seen gold move from the close of 942.7 on 03/06/09 to a high of 962.6 on June 5th, 2009, a 2.1% gain, and crude oil move from the close of 45.52 on 03/06/09 to a high of 68.44 June 5th, 2009, a 50.3% gain. Clearly, the move in crude oil has been stronger and oil moved higher to gain ground against gold, pulling the ratio down to 14.1.
Now that the ratio is trading back under 15, the question will be, “Will we see crude oil continue to move in this direction?”
15.0: Support?
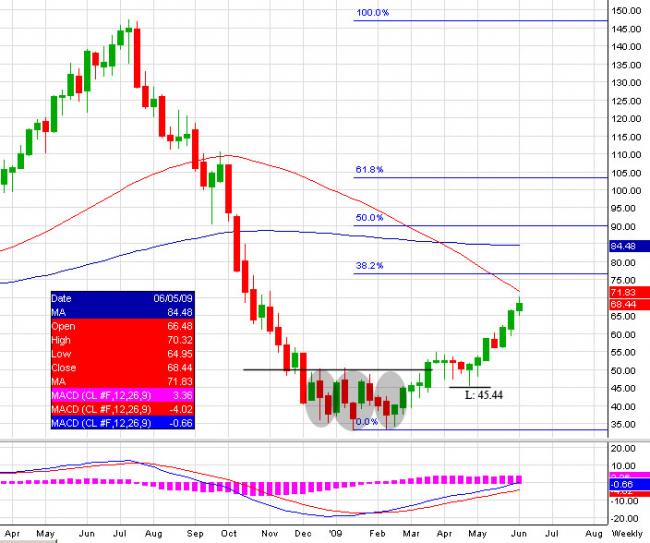
Continuous Front Month Light Sweet Crude Oil Weekly:
Past performance is not indicative of future results.
Looking at the weekly chart above, you see the inverted head and shoulders formation set between December and March. After breaking the downtrend from the highs of last year in February, oil broke above the neckline of $50.00. Then, many received their ‘confirmation’ to finally go long. This ended up testing the patience of the longs as oil pulled in to test the $40-45 support level, by making a low of $45.44 during the week of April 24, 2009. However, holding it’s first tier of support ($45). As this level held and the market pushed higher, we have now seen a squeeze and a breakout with prices touching off a high of $70.32 on June 5th, 2009.
Remember the fundamentals in February were not great, in fact they were bearish. It was the technicals that gave a potential trade setup and a buy in crude oil, now that the market is 75% higher, “Are the fundamentals any better?”
The 70’s will be dicey as the market brings in many levels of resistance, and new sellers start coming into the market. The 70’s also bring the 50day, 100day, 200day moving averages, and a 38.2% retracement from the highs of last July to the lows of January 16, 2009. As the fight between the bulls and bears emerges here, look for consolidation for the market to find direction.
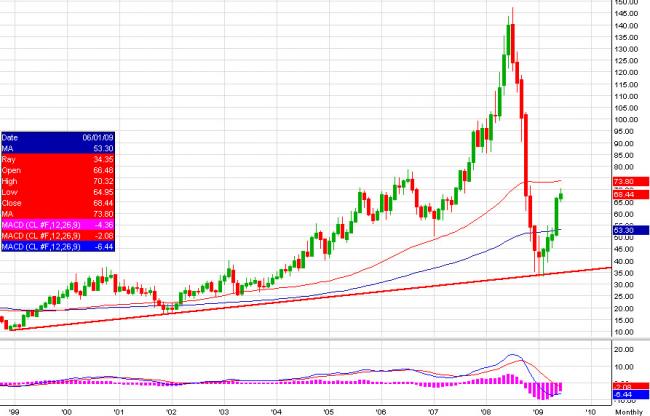
Continuous Front Month Light Sweet Crude Oil Monthly:
Past performance is not indicative of future results.
The monthly chart above shows crude making lows down to $33.20 in January, and finding support from long term trend 1998 lows ($10.65) to 2001 lows ($17.12). The market has since moved off these lows and rallied $37.12 or 111.8%.
Longs in near $40, and longs who added on the break above $50 have significant paper gains. Seeing a $30.29 or 75.66% gain since February 22. One never wants to give back what the market has given, and in the same sense, one should not let go of a winner to easily! So, “What to do?” Protect gains, raise stops, use targets, and stay patient. Bulls look for a target of $85.00-$90.00.
(See “Does Black Gold Have Any Luster In The Near Future” on February 22, 2009 for reference).
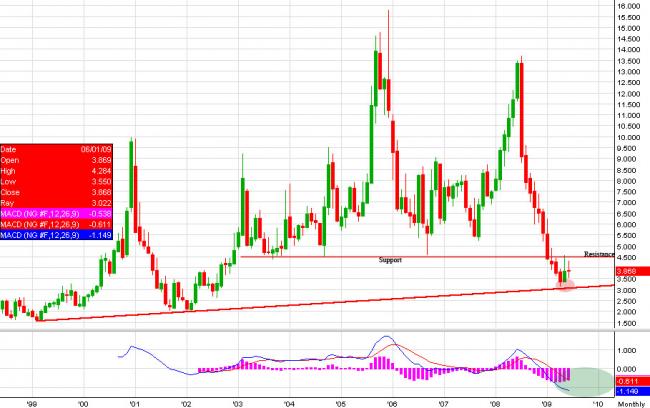
Continuous Front Month Natural Gas Monthly:
Past performance is not indicative of future results.
Looking at the long term natural gas monthly chart above, see that the market pulled to the trend line dating back from 1999 to 2002 lows. Similar to the crude oil monthly, except the market is lagging crude oil. One thing concerning from the chart above is that the market has not completely touched the trendline as oil did a few times. This market is trying to form a base, and many people are jumping on the ship anticipating the bottom. However, it will not happen overnight (just as crude oil’s base did not) and ‘many’ people will not make money. The market passes money to the few not to the many. The time that passes as natural gas trys to form this base will erode and unnerve longs in the market, in my opinion.
Continuous Front Month Natural Gas Weekly:
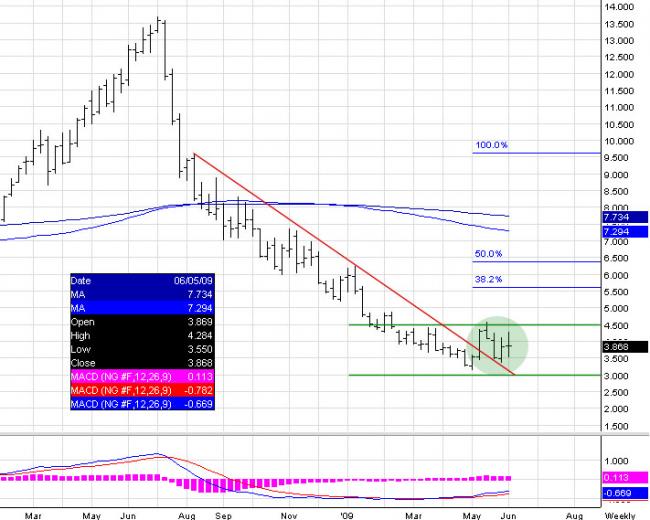
Past performance is not indicative of future results.
Notice a clear break from the downtrend. The market quickly rallied before finding strong resistance at $4.50. Also, notice that it pulled back to find support at $3.50. I see a bull flag here. The market will need to break above $4.50 to attract confirmation buyers standing on the sidelines.
US Dollar Index : Natural Gas Daily:
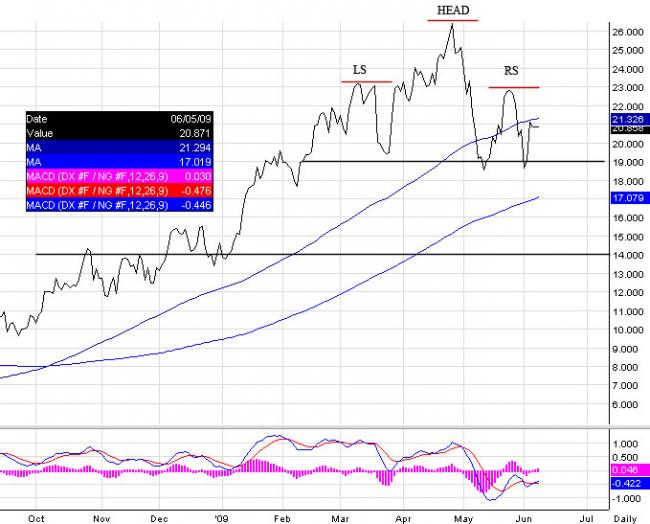
Past performance is not indicative of future results.
Now, we look at the relationship of Natural gas into the US Dollar Index. Daily shows a potential topping formation, indicating potential strength in Natural Gas to come.
Receive emails and alerts ahead of time, visit Stewart Solaka @ Lasalle Futures Group
Thank you and best of luck trading!
PAST PERFORMANCE IS NOT INDICATIVE OF FUTURE RESULTS. THE RISK OF LOSS IN TRADING FUTURES AND OPTIONS IS SUBSTANTIAL AND SUCH INVESTING IS NOT SUITABLE FOR ALL INVESTORS. AN INVESTOR COULD LOSE MORE THAN THE INITIAL INVESTMENT.
Comments and questions to the author, please write ssolaka@lasallefuturesgroup.com or call 888-325-9300.
Follow www.twitter.com/chicagostock
Stewart S. Solaka
LaSalle Futures Group
Chicago Board of Trade Building
141 W. Jackson Blvd. Suite 2921
Chicago, IL 60604
Chicago: 888.325.9300 / 312.554.3900
Fax: 312.554.3908 Email: ssolaka@lasallefuturesgroup.com
Web: http://www.lasallefuturesgroup.com/stewart_solaka.php
Twitter: www.twitter.com/chicagostock

