
(Note: Unless otherwise stated, the index action described below relates to the EMini futures contracts for the respective indices. Actual index action may differ slightly in terms of pattern formation, although the market bias will remain the same.)
MONDAY’S MARKET WRAP-UP
Market Snapshot for October 24, 2011 (11:20 p.m. ET):
Closing Prices: DOW 11,913.62 (+104.83, +0.89%), S&P 500 1,254.19 (+15.94, +1.29%), NASDAQ 2,699.44 (+61.98, +12.35%), Nikkei 225 8,820.29 (-23.69, -0.27), DAX 6,055.27 (+84.31, +1.41%), FTSE 5,548.06 (+59.41, +1.08%)
OIL 91.65, GOLD 1,657.40, SILVER 31.795
EURO 1.3916, YEN 76.06, BRITISH POUND 1.5995, U.S. DOLLAR INDEX 76.345
OUTLOOK
After flirting with the 100-day moving averages for just over a week, the Dow Jones Ind. Average ($DJI) and S&P 500 ($SPX) finally pushed through them on Friday to strike the next level of daily resistance we’ve been watching at their 200-day moving averages. As we head into Tuesday’s trade we are once again looking for corrective action with a strong potential for seeing the day’s highs having already hit in premarket trade. Both of these major indices had three distinct highs hit on the 15 minute time frame on the all-sessions charts between Friday and Monday. They then paused longer in overnight trade with a gradual pullback afterhours on Monday into early Tuesday morning before breaking to a fourth high. This leaves the trend exhausted with a high probability of a break in the 15 minute uptrend channel.
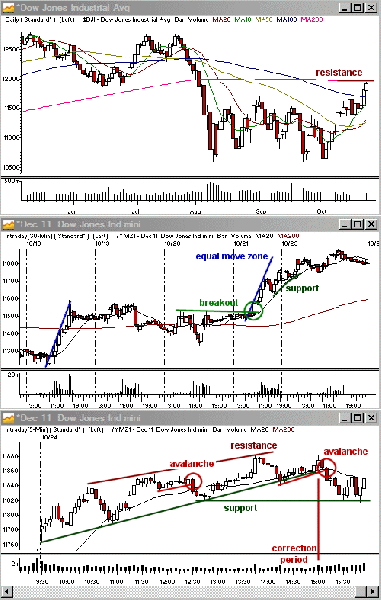
Dow Jones Industrial Average (Figure 1)
http://tonihansen.com/Newsletters/dow1.gif
Monday’s Price Action
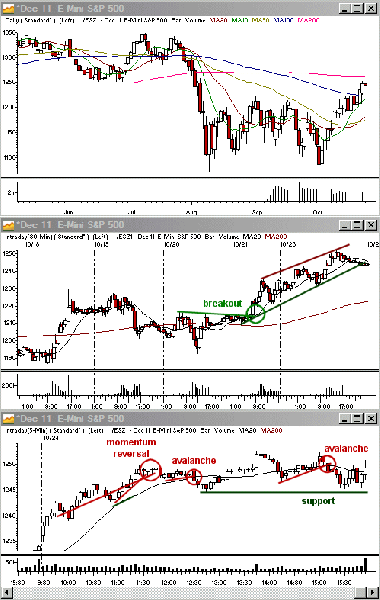
The market has a decent uptrend day on Monday as the breakout from Friday continued, but the pace shifted between Friday’s highs and Monday’s highs. The slowdown created plenty of opportunity for intraday traders looking to take advantage of the 5 minute price swings, but was more of a test of patience for those holding the larger time frames since it meant more overlap in price action on the 15 minute time frame from one bar to the next as the market slid into upper channel resistance on that time frame (shown in Figure 2). This level of resistance was also the 200-day moving averages in the Dow and S&P and equal move resistance on 5 and 15 minute time frames (Figure 1). Meanwhile, the Nasdaq has to deal with resistance of its own as it approaches July’s highs.
S&P 500 (Figure 2)
http://tonihansen.com/Newsletters/sp1.gif
Index Wrap-up
The Dow Jones Industrial Average ($DJI) ended the day on Monday with a gain of 104.83 points, or 0.89%, and closed at 11,913.62.Twenty-three of the Dow’s thirty index components posted a gain. The top performers were Caterpillar (CAT) (+5.01%), Bank of America (BAC) (+4.02%), JP Morgan (JPM) (+3.44%), and Alcoa (AA) (+3.42%). The weakest were Procter & Gamble (PG) (-1.34%) and Verizon (VZ) (-1.31%), and AT&T (T) (-0.86%).
The S&P 500 ($SPX) finished the session with a gain of 15.94 points, or 1.29%, and closed at 1,254.19. The greatest strength was in the materials and financials. Top percentage performers in the index were CBRE Group (CBG) (+9.48%), Alpha Natural Resources (ANR) (+9.48%), and Freeport McMoran Copper & Gold (FCX) (+7.98%). The weakest industry groups were telecoms and consumer staples and the weakest individual performers were Kimberly Clark Corp. (KMB) (-4.59%), Marathon Pete. Corp. (MPC) (-4.02%), and Sprint Nextel (S) (-2.89%).
The Nasdaq Composite ($COMPX) ended the session higher by 61.98 points, or 2.35%, on Monday and it closed at 2,699.44. The strongest performers in the Nasdaq-100 ($NDX) were Green Mountain Coffee (GMCR) (+8.67%), Baidu (BIDU) (+8.07%), First Solar (FSLR) (+7.77%), and Ctrip.com (CTRP) (+6.55%). Only Costco (COST) (-0.96%) and Sears Holdings (SHLD) (-0.08%) posted a loss.
Nasdaq Composite (Figure 3)
http://www.tonihansen.com/Newsletters/nas.gif

