
Since we are starting a new year, it’s time to look at what’s happened in the markets from a macroeconomic perspective, and where that may be pointing to us in the future. My analysis shows a possibility 2010 could mark a return to the trends in place at the end of 2008, with a stronger U.S. dollar, weaker commodities and a bearish looking stock market. I will take a look at chart patterns in several markets that took shape over the past year and a half, and offer some possible scenarios based on one technical analysis method I favor, Elliott Wave.
We had wonderfully high peaks in markets like crude oil, copper, etc. in early to mid-2008, followed by major meltdowns by the end of that year. Last year was a corrective year after those dramatic declines. I see major macro changes now underway.
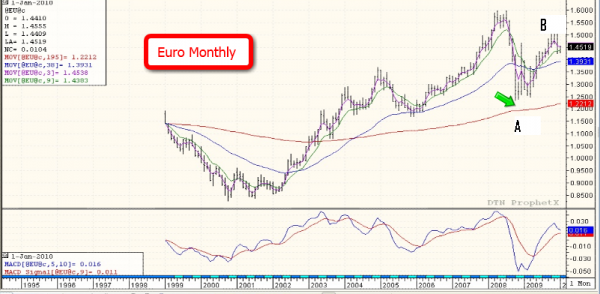
Euro
First, let’s look at the euro. A chart of the euro futures shows the top around $1.60 and the bottom around $1.20 in 2008. The market has corrected higher from that low, the “A” wave of the move (marked by the green pointer). The market is now trading around $1.45 in wave “B” of the move at the far right of the chart. The correction from the major sell-off, if it is complete could start the “C” wave down this year.
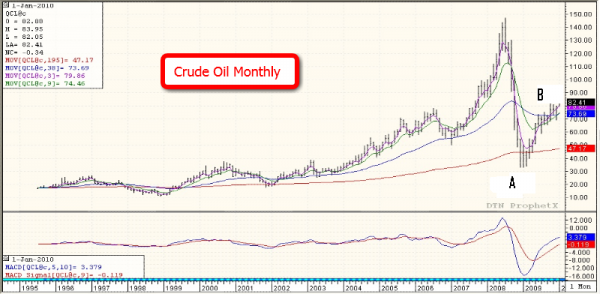
Crude Oil
Crude oil shows a similar picture, on an even more dramatic scale. This is another market that made a substantial peak, dropped, and recovered. A move to $100 a barrel would mark a 60 percent correction off the lows hit in early 2009. You can see the “A” wave down and the correction in 2009 as the “B” wave. If we are to follow a 3 count correction a “C” wave down could start in 2010.
Dow Jones Industrial Average (DJIA)
The DJIA is the broadest representation of market psychology and like the other markets mentioned, has seen a big plunge and a substantial correction, also following the same three count pattern (green pointer marking the “B” wave up). It could extend the move a little more this year, but I don’t think it will surpass the highs of 12,000 – 13,000 from 2008, based on what I see in the classic technical setup.

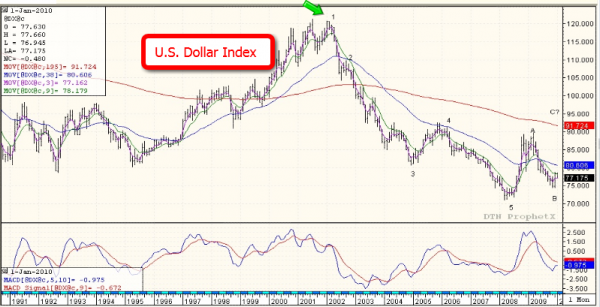
U.S. Dollar
The dollar is the glue that holds many other commodity markets together, as most major commodities are priced in U.S. dollars. The chart of the ICE Dollar Index futures shows evidence of a major/macro second-wave bottom.
I think the U.S. dollar is showing the most solid signs of a turning point of the previously mentioned markets. You can see the highs from 2001 – 2002 in the next chart, then count the five waves down. The financial meltdown in 2008 saw a dramatic lift-off, creating what appears to be the first corrective wave “A” up. We appear to be in the “B” wave now (far right of the chart), the second part of that correction, which is really more of a sideways trade. The next move should be to the upside.
The market could take out the low and that would change the look of the correction, but the initial impulse wave leads me to believe this is something powerful to signal a shift. The dollar started to rally in late December 2009, and I think the market is attempting a bullish trend shift. Going forward, unless things dramatically change, I see the high around 90 seen the latter part of 2008 – early 2009 retested and taken out. We might see a “C” wave in 2010, or possibly the third of five waves up. We won’t know for sure until we get into it.
So much is predicated on what the U.S. dollar does, so this could dictate the direction for many commodities markets as well as the financial markets.
Of course, there are many fundamental reasons for the dollar to remain weak. Multiple deficits, printing money, expanding the Fed’s balance sheet….you might be wondering how it could go up given all this. As a technician, you have to put that aside, and let the market tell you what it wants to do.
The point isn’t to marry yourself to a view, but to determine probabilities that make sense to you as a trader. After such a large, multi-year drop in the dollar, it makes sense to look for a bottom. It’s impossible to project exact levels of course, but if you are going to participate in the markets, you have to try to understand the trend, and where it could be going. The dollar could be the potential 2010 star.
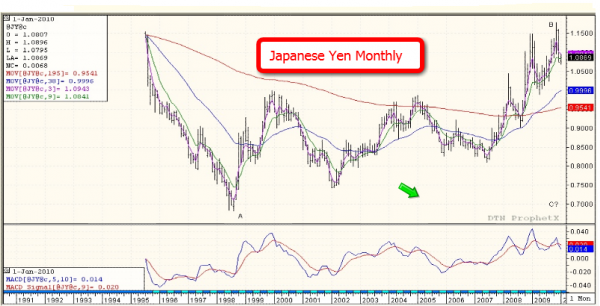
Japanese Yen
While the euro best mirrors the U.S. dollar, the Japanese yen marches to its own beat. However, it is clearly looking like a major/macro degree turn has started in this market as well. It shows a yearly exhaustion pattern and has dropped over half its yearly range just since late November. The chart shows a dramatic looking picture.
You can see the high above 1.18, and the drop into 1.10 or so currently. The yen hasn’t been at these levels since the early 1990s. The peak on this chart is in 1995, but the yen was even higher prior. We could see a multi-year giant correction off that high from the 90s. If this pattern follows other macro events, it could lead to a plunge to take out the “A” wave. This probably wouldn’t happen quickly, it could take two years or longer. If this is a major turn in the yen, then I think it offers a great trade potential on the short side. The yen could come up to a range of 1.12 to 1.14, where I’d be interested in looking to sell for a possible major move down to complete the “C” wave of the pattern.
If the 2009 high in the Japanese yen proves to be a “B” wave peak, the “C” wave slide, which I believe has likely already begun, will support the idea that the dynamics of the marketplace are changing in a very big way.
The yen has traditionally been a carry trade currency. While the U.S. dollar has taken that role in the past year, the Japanese economy has been in a deflationary spiral with rates near zero for decades. I look at the yen as a great trade to consider in 2010, like the U.S. dollar, on the cusp of a possible sea-change.
Gold
Gold peaked late in 2009 above $1,200 an ounce, and then sold off only slightly. Gold is tougher market to read than some others, because it has different variables investors take into consideration. It has use as a store of value, as an inflation hedge, and a dollar play. It’s also a go-to in times of distress. This market’s cycle doesn’t quite fit the way the other markets do, and gold may try to move higher. It might not yet have seen its peak.
However, as much as I’m personally bullish gold, I can’t ignore the fact the U.S. dollar could thwart gold’s outlook, and check commodities in general from running back to their old highs. Gold made a monthly reversal and could be potentially very negative in 2010, unless it can clear the high of 2009 with a weekly close above $1,227.
Additional Thoughts
When a year (such as 2009) has been dominated by countertrend, corrective activity to a major degree, it’s not uncommon for the marketplace to almost completely change its character at the start of the next year. We aren’t far enough into 2010 yet to get a complete picture. However, based on the patterns I see on the charts, I believe once these markets pass through their corrective periods, the down trends of 2008 should resume. Downtrends may be around the corner in 2010 for markets like crude oil, stock indexes, and the Euro.
Andrew Vallance is a Senior Market Strategist based in Toronto, and is serving clients in Canada. He can be reached at 416-369-7948 or via email at avallance@lind-waldock.com. You can follow Andrew on Twitter at www.twitter.com/LWAVallance.
The data and comments provided above are for information purposes only and must not be construed as an indication or guarantee of any kind of what the future performance of the concerned markets will be. While the information in this publication cannot be guaranteed, it was obtained from sources believed to be reliable. Futures and Forex trading involves a substantial risk of loss and is not suitable for all investors. Past performance is not indicative of future results. Please carefully consider your financial condition prior to making any investments. Not to be construed as solicitation.
MF Global Canada Co. is a member of the Investment Industry Regulatory Organization of Canada and Canadian Investor Protection Fund.
Futures Brokers, Commodity Brokers and Online Futures Trading. 123 Front St. West, Suite 1601, Toronto, Ontario M5J 2M2.
© 2010 MF Global Holdings Ltd. Lind-Waldock, a division of MF Global Canada Co. Toll-free 877-501-5463. Lind-Waldock promises never to sell your information to anyone.

