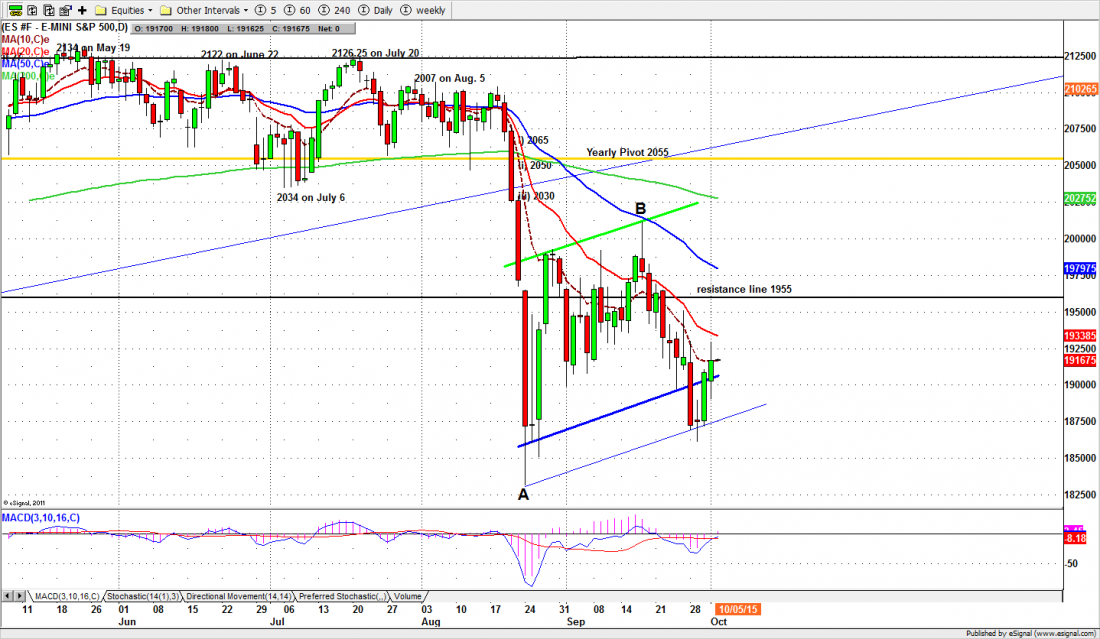
S&P 500: Bells they ring at the top
Years ago, when the internet was still a novelty, I was mentoring a young trader who started following something new, a message board (I think it was AOL) that was carrying a series of articles entitled: Bells they ring at the top. My student asked, in all innocence “do they really ring a bell when the market reaches the top?”
If only. The idea started with Lloyds of London, which kept a ship’s bell in the underwriting room and rang it when there was important news – once for bad news, twice for good. Since then the phrase has become a kind of short hand among traders for indicators that suggest the market is topping. And lately the bells have been ringing.
Here are some of the things we watch:
- Failed rallies. The markettries to make new highs, but the rallies don’t hold and the market makes a series of steps down, followed by bounces that don’t make new highs. You can see an example of the chart below.
- Volume fades on the way up, increases on the way down. When the Bull is dead or dying the rallies don’t attract traders, but the declines do. Investors trapped in losing positions are rushing for the exits, and sell into rallies. Volume increases.
- Higher volatility. The intraday price swings start to get bigger, and we often see sudden, sharp price surges. We’ve seen a modest version in the last couple of days. The surges seldom last.
- Waterfall down days. The marketmakes triple-digit declines, sometimes for several days in succession. The bottom just drops out and the buyers disappear. See late August on the chart.
Those are just indicators, not laws of physics. But we are seeing more of them lately, and our intermediate term outlook is bearish. This just doesn’t look like the right time to go plowing into equities at a long-term investor.
But for short-term traders, there are still opportunities every day … including today.
Today
The closing price action of the S&P500 mini futures (ES) was quite bullish Thursday, but the volume was 8.8% below the previous day. ES closed at 1916.75, right at the 10-day moving average line. Today it could move up to Thursday’s overnight high at 1929.75 or further up to the 1935 area – the 20-day moving average.
This morning we have the non-farm payroll report before the open, and that will largely determine if the current rally should continue or pause. If the futures fail to move back above 1919.25 early in the morning the price can still pull back around the 1900 level to shake out the weak hands… like us. For the short term, we should still expect an oversold bounce today.
Major support levels for Friday: 1850-45, 1830-25, 1800-06, 1775-85, 1750-55;
major resistance levels: 1931-28.50, 1945-55, 1998.75-95.50
For more detailed market analysis from Naturus.com, free of charge, follow this link
http://www.naturus.com/mailing-list-signup-page/
Chart: S&P500 mini futures (ESZ5) Oct. 1, 2015