
 While I love a good Ouija board as much as the next guy, I’m not big on TA.
What I am a fan of is the law of large numbers, fundamental analysis, freakonomics, chaos theory, psychohistory and crowd psychology – all in the elusive search for the objective truth, which I have on good faith is 42.
Surprisingly enough, based on this outlook, I get a lot of consulting work and sometimes that consulting work led me to consult on trading systems and that led me to figuring out a very useful system for predicting the move of the markets without charts (though I’ll use them to illustrate points) and without all the silly fuss that TA guys make about their “craft” (sorry Dave).
The 5% Rule does NOT tell you which way the market is going. It does tell you where the resistance points will be. Of course, knowing that and knowing what kind of bounces to expect and knowing where a proper breakdown or break-out occurs is kind of useful and, when it coincides with the tea leaves that are read by the “real” TA guys – you can really have something good to go by!
Unfortunately, the 5% Rule is not really a RULE because it requires a cynical background in statistics, especially regarding aberrant values or “outliers” and a general understanding of market history as well as current market events because all need to be taken into account in order to give you accurate “consolidation levels” from which we base out chart movement.
For example, not to get too into it now but a while ago I pointed out that our V-shaped recovery on the S&P, etc. wasn’t all so impressive if you consider that the drop from 800 to 666 was simply a panic spike and was not statistically relevant. That means that the S&P is not up 80% at 1,200 but is, in fact, up 50% off what we call the “non-spike” floor at 800 after topping out at 1,576.09 in October of 2007:
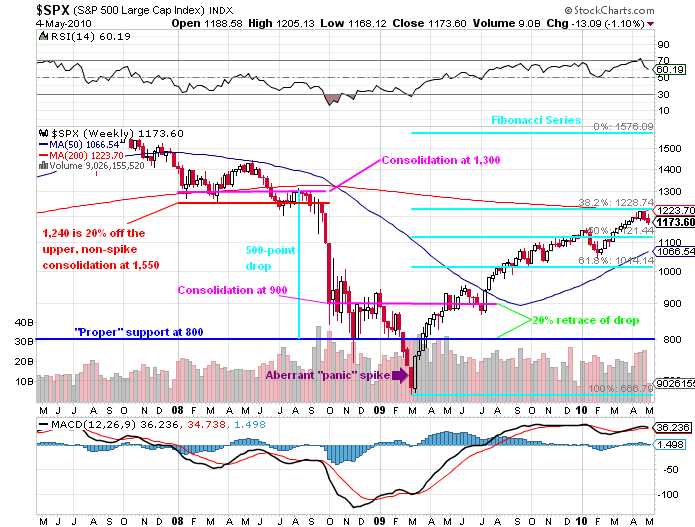
There are a lot of things going on here but I wanted to impress on you that they are, to a large extent, the same thing! The Fibonacci series, which is a study of regressive sequencing that incorporates elements of chaos theory, statistics and the law of large numbers and tends to work very well when studying market movements. Without getting too off topic, the key point is you can expect to hit resistance points between two significant…

