With the U.S. markets closed yesterday perhaps the biggest news was the 3% decline in the Chinese shares market.
Jan. 17 (Bloomberg) — China’s stocks plunged, driving the benchmark index down the most in two months, as the central bank ordered banks to set aside more reserves and rising property prices signaled policy tightening measures may be expanded.
Due to a lack of inspiration emanating from spending a day intently watching a quote screen that never changed… we are going to quickly run back through the argument that we introduced in yesterday’s issue.
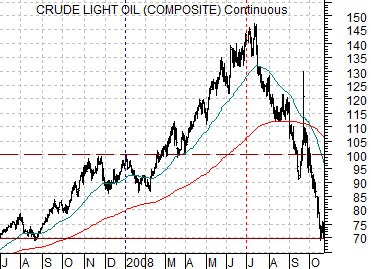
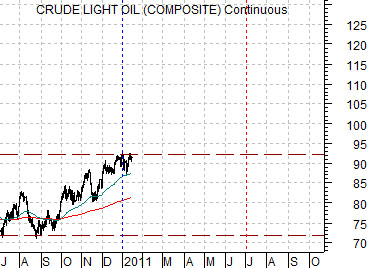
Below are two charts of crude oil futures. The top chart runs from July of 2007 through October of 2008 while the lower chart begins in July of 2010.
The argument was that the chart pattern for crude oil futures through the second half of 2010 was quite similar to that of the final two quarters of 2007. Given that crude oil prices busted to record highs through the first half of 2008 even the remotest of possibilities of an impending ‘do over’ warrants our attention.
We argued on occasion a few years ago that ‘recessions change trends’. The problem is that similar to the 1987 stock market ‘crash’ the melt down during 2007 and 2008 may have lowered prices but the base trend (Asian/emerging markets/Latin/commodity etc.) remained essentially unscathed. With the same groups leading the recovery that led the markets to the prior peak we have the nagging sense that a ‘do over’ is within the realm of likely outcomes.
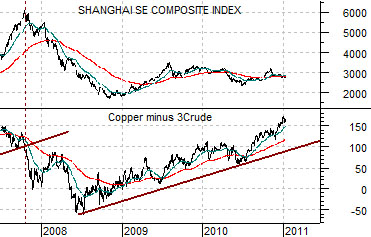
Below is a comparison between China’s Shanghai Comp. and the spread or difference between copper futures (in cents) and crude oil futures (in dollars times 3).
Our view is that ‘copper stronger than crude oil’ is a key component of the ‘strong China or strong BRIC’ theme. With copper prices at record highs even as the Chinese equity market trends somewhat lower we can quite easily imagine a trend developing this year that includes either weakness in copper prices or… marked strength in crude oil prices.
Equity/Bond Markets
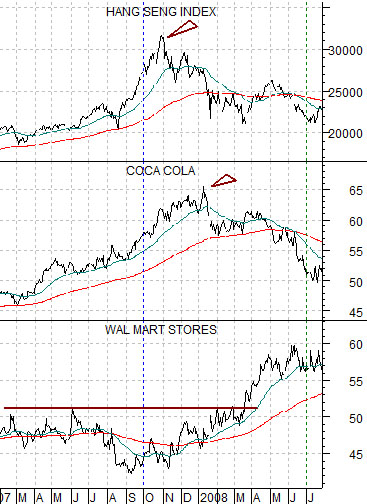
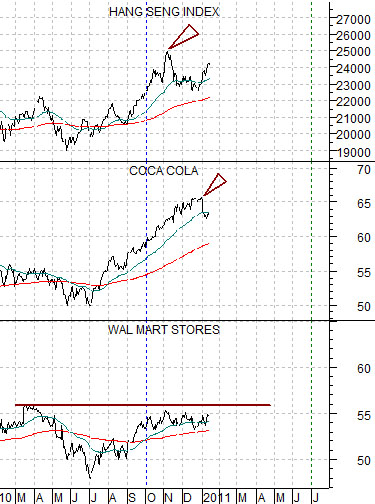
Below are two chart comparisons of the Hang Seng Index from Hong Kong, Coca Cola (KO), and Wal Mart (WMT). The chart below is from 2007- 08 while the chart below right is from 2010 into 2011.
What we are attempting to do is compare the way the Hang Seng Index and Coke made peaks towards the end of 2007 with the market rolling into Wal Mart as a defensive response.
The Hang Seng Index peaked in November of 2007 and in November of 2010. Coke peaked in early January of 2008 and may have peaked a second time right at the start of 2011.
Through 2007 Wal Mart was making a base with a price break out reached in March just after crude oil futures prices moved to new highs. If history were to repeat the Hang Seng Index would resolve lower along with Coke while WMT works eventually up through 56.
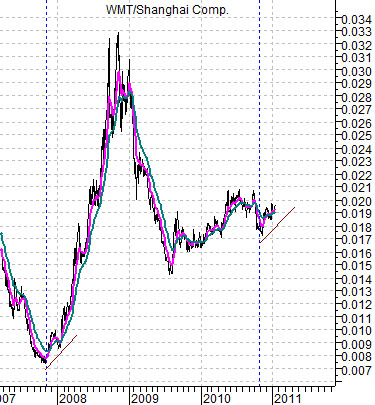
Last is a chart of the ratio between Wal Mart and the Shanghai Composite Index.
As mentioned yesterday there are any number of differences between today and early 2008. Perhaps the most compelling difference would be the slope of the U.S. yield curve but, then again, we are focusing on the similarities instead of the differences. The upward push in the WMT/Shanghai Comp. ratio does bear a certain visual similarity to the start of 2008 so this will be one of the market features that we will keep an eye on as we move through the first quarter of this year.