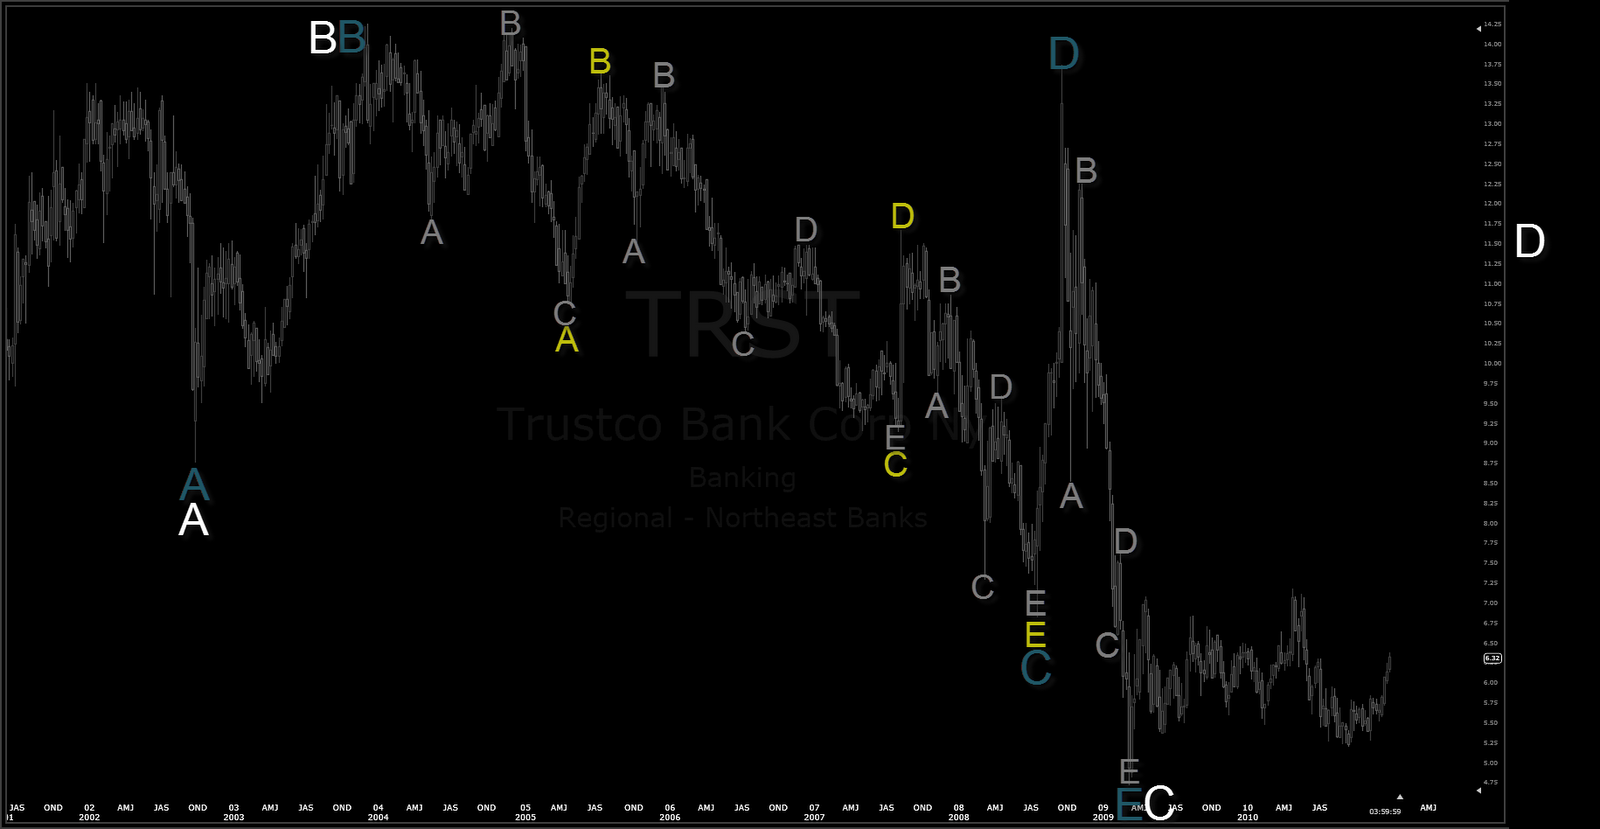
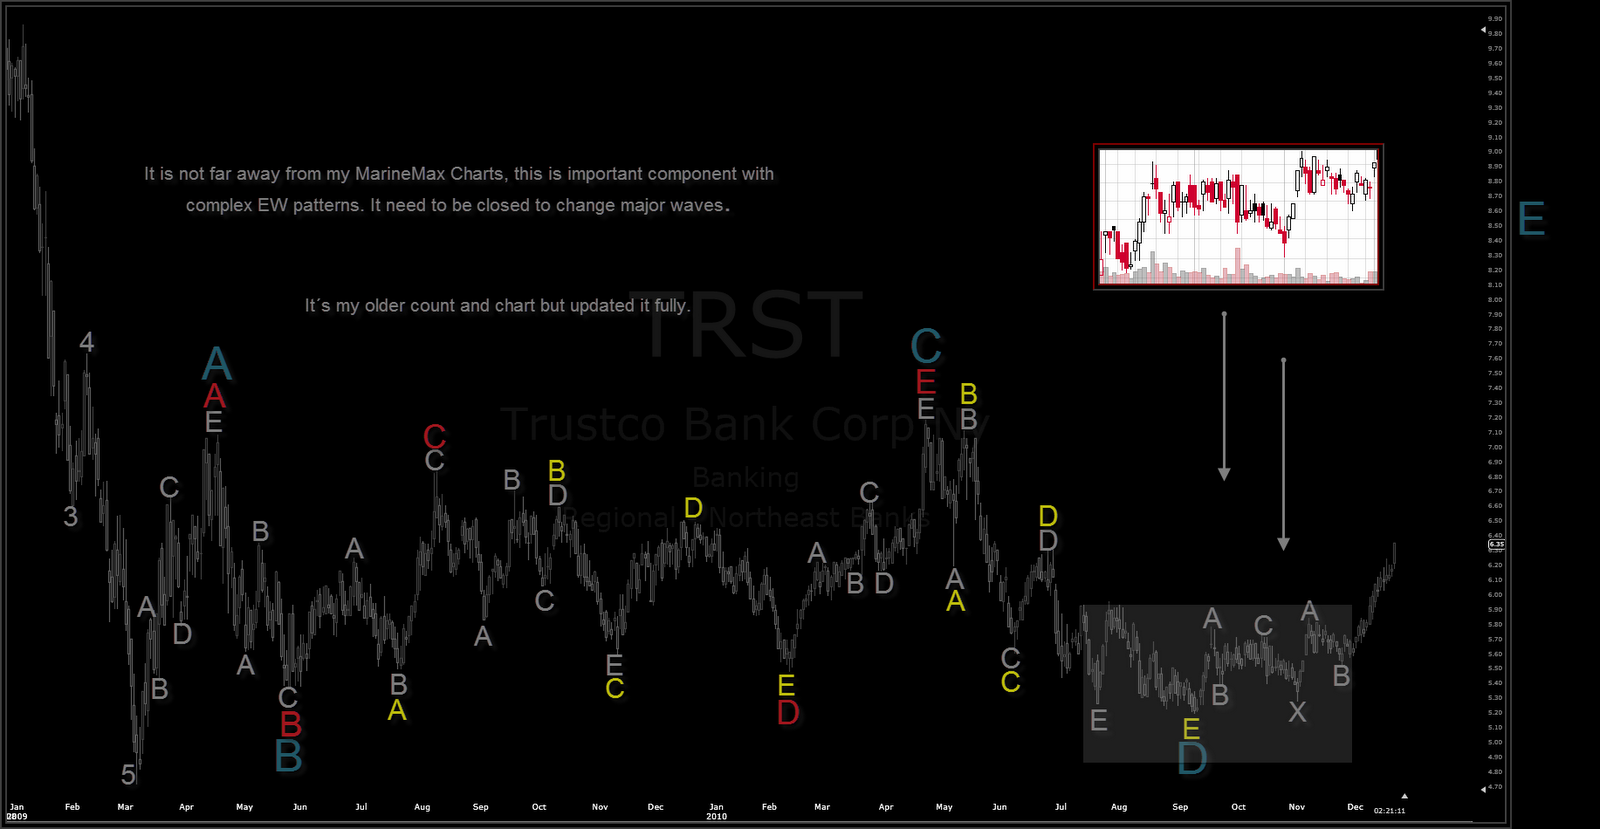
It is my older chart but re-labelled waves for it (even it hasn´t change anywhere).
All EW theorist have anyway allways bearish charts & world ending scenario exist and it can be the one also, some day but not for some time to come I believe.
Since EW is expanding theory this white D is my best guess it is looking at minium. Where it is exactly or when is way or another related where those previous “D” waves were. Even if it would not be there market would consider it, however more interesting for now is that I think it is trying to do the same as inverse ie. expand triangle for upside. Too early to look any white D´s yet but it gives a clue how chart might be taking it and what kind of EW behaviour(s) there would be while travelling.