
The S&P 500 cash index (SPX) closed at 1199.21 on Friday for a net weekly loss of 26.64 points, about 2.2%.
The bulls driving the two-month rally ran out of gas last week, at least temporarily. Just a week ago SPX broke April’s high and made 1226 for the first time this year; last week it closed under 1200, amid new worries about … well, almost everything. Read on.
Technical analysis
SPX Weekly chart
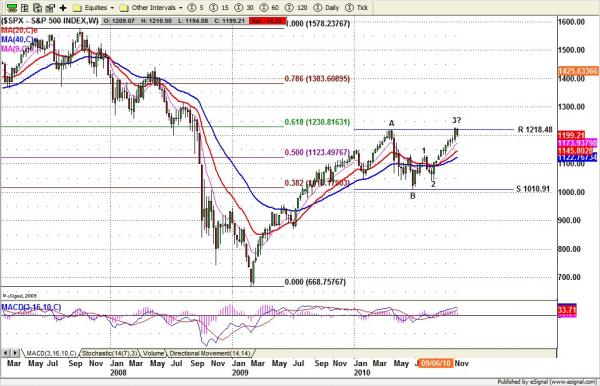
On the long term chart above you can see that SPX is hovering around the key 61.8% Fibonacci retracement level between the 2007 top and the March 2009 bottom. The question this time is whether SPX will have a decent pullback move or stay in a narrow congestion range for several weeks as it did last year.
On the weekly chart we see three possible scenarios:
- Based on wave structure, the 1226 area could be a sub-wave 3 top of C, and sub-wave 4 could be in process right now. As long as 1137.30 area holds the SPX up, the price still can be pushed back up to form a sub-wave 5 up first before the rally from the August low ends
- The 1226 area could also be the C top of a broad sideways range movement. So far the price hasn’t managed to close above April’s high. But intermediate-term momentum indicators have all approached or entered overbought territory. The price could be pulled back down in a move similar to the A to B move on the chart.
- The third is based on Fibonacci retracement. The entire rally from 2009 to the current level is equal to a 62% retracement. November’s high might be just a test or the retracement top, forming a possible double top pattern. If this pattern stands, this week the bounce shouldn’t exceed 1211 level; to confirm this analysis the price needs to break down 1137.30 in the following weeks to establish a series of lower lows.
All three outcomes are possible. Option expiration this week may favor the first outcome. The price could go down to search for support and try to bounce back up before option expiration on Thursday.
Comment
Economic reports for manufacturing, the service sector, retail sales, durable good orders, even unemployment have shown improvement in recent weeks. The credibility of these reports is often questioned — especially the employment numbers which showed an unexpected surge of 151,000 new jobs created, more than double the 70,000 expected, after the Bureau of Labor Statistics indulged in a little more data manipulation.
But the headline numbers are good and the three major indexes rallied back above April highs, before a pullback. Insider selling is extremely high, perhaps due to the approaching year-end and the uncertainty about the continuation of the Bush tax cuts. Individual investors are excessively optimistic; the AAII survey showed 57.6% bullish, which was the highest level of the entire bear-market period starting in Oct. 2007, about a four-year high.
But last week, SPX closed down roughly 2.2% for the week, matching similar pullbacks in other countries, including Brazil, India, South Korea, China, and Japan. This is what investors are worried about now:
- concerns that the QE2 plan may cause US inflation;
- worries that declines in the sport Gold price may be the precursor of similar declines in oil and other important commodities;
- fear that the Chinese government may hike interest rates to respond to high inflation in China, which could slow the global economy;
- anxiety about a potential currency or trade war if the current devaluation of the USD continues.
Lots of uncertainties will tend to keep the price from rising; at the same time technical indicators show the market moving into an intermediate-term overbought condition. A price pullback should not surprise us.
Monthly resistance 1250 and support 1145; Weekly resistance 1225 and support 1175
SP 500 e-min futures – Daily outlook
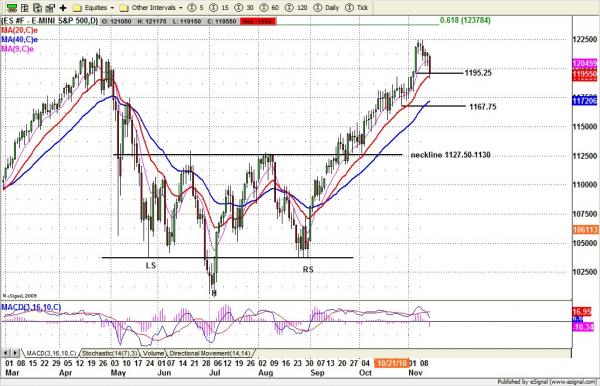
ES broke the first support at 1195.25 Friday, but it still managed to close slightly above it.
Overnight Sunday and early Monday we should see a continuation low move. This move may just shake out weak hands overnight or in an early morning decline. As long as 1180.50 holds ES up, the price could reverse up to attempt to fill any opening gap and go further up to retest last Friday’s high area.
A move under 1179.50 will be bearish and then a move further down to 1175-73 range should be expected.
To see the trading strategy for Monday, download Nat’s weekly market prview at www.naturus.com. Free registration required.

