Major averages approaching resistance – The Wagner Daily 
The Wagner Daily – November 11, 2010
Concise technical analysis and picks of the leading global ETFs
Commentary:
Following through from Tuesday’s distribution, stocks struggled at the open on Wednesday. But, at 10:00 am the markets reversed and trading ended up on the day. The action was subdued, as volume was modest throughout the day. All of the major indices closed in positive territory. The small-cap Russell 2000 and S&P MidCap 400 led the advance by posting 1.2% and 0.9% gains respectively. The Nasdaq advanced 0.6%, while the S&P 500 managed a 0.4% gain on the session. The Dow Jones Industrial Average was the laggard on Wednesday, as it struggled to close in positive territory. Still, it did manage a 0.1% improvement on Wednesday.
Turnover was down for the session. Volume fell by 9% on the Nasdaq and 1.9% on the NYSE. Advancing volume outpaced declining volume on the Nasdaq by a ratio of 1.4 to 1. On the NYSE, the ratio finished slightly better at 2.2 to 1.
In light of Tuesday’s selling pressure, it is useful to evaluate the broad market to gain a better picture of support and resistance levels. Below are two charts of the Dow Jones industrial average. On the daily chart you will notice that we recently rallied above the April 26th swing high of 11,258. During today’s session the market briefly tested, and then bounced off of the former swing high set in April. This now represents support. The predicted rally of the inverse head and shoulders (measured from bottom of head to neckline), establishes a potential area of resistance at 11,600. These technical indicators suggest that the market may be due for a correction.
The 15-year monthly chart of the Dow Jones Industrial Average provides another perspective of potential market resistance. Notice, that just above the 11,600 resistance level on the daily chart, looms another zone of resistance at 11,800. Not only does this level coincide with the January 2000 swing high, but it may also represent the start of the right shoulder in a decade long Head and Shoulders formation. It is also noteworthy that volume has been declining since the rally began in March 2009. Until the pattern forms, it is not possible to know if we are in the midst of a major head and shoulders pattern. However, we do know that the January 2000 high of 11,800 will likely provide significant resistance for the DJIA.


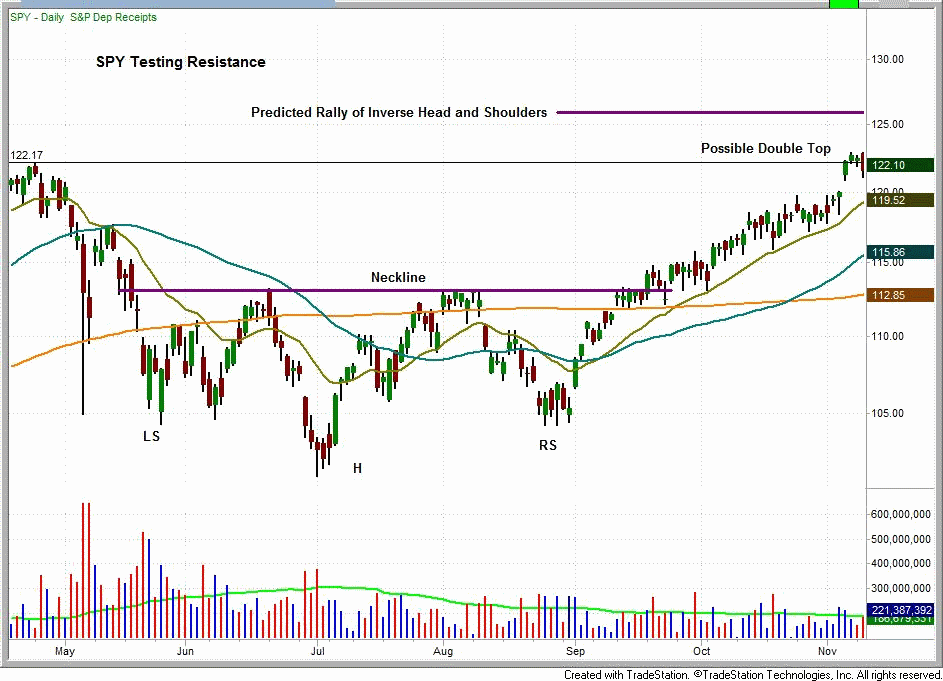
The SPDR S&P 500 ETF (SPY), may also be close to reversing the current uptrend. The technical pattern is eerily similar to that of the DJIA. It is possible that we are in the midst of forming a double top formation. The SPY briefly rallied above the April high, sold off and is now trading just below that high. Further, the predicted rally of the inverse head and sholders pattern for SPY is approximately $126.00. This is just above the double top that is possibly forming.

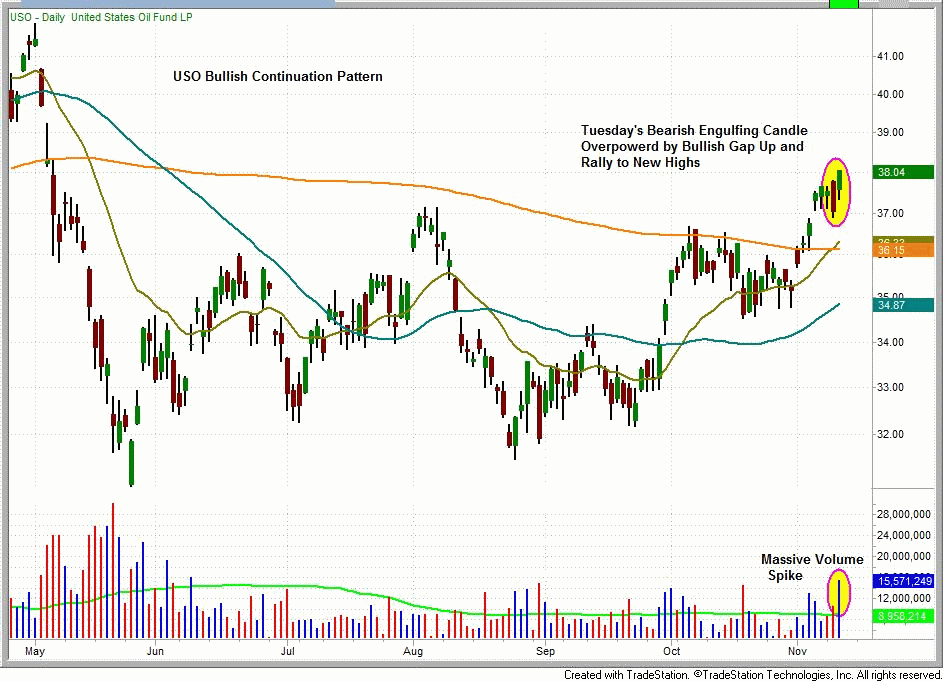
Our position in USO remains strong. Despite Tuesday’s bearish engulfing candle, USO gapped up on Wednesday and rallied on big volume into the close. Wednesday’s strong reversal will likely create a short squeeze and further fuel the rally.

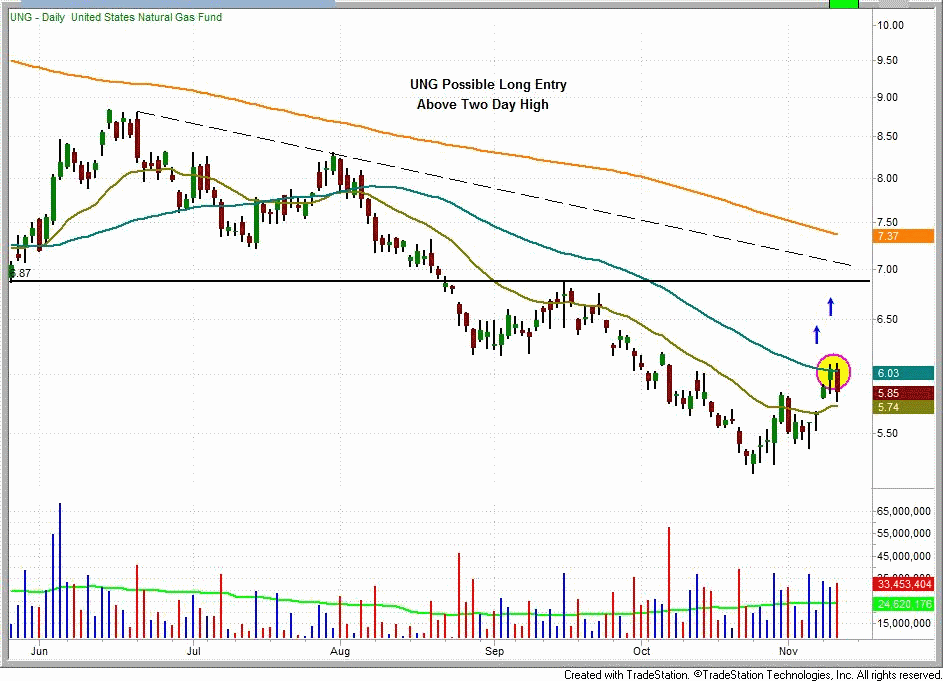
After a bullish gap day on November 8th, the United States Natural Gas ETF, LP (UNG), rallied into the 50-day MA on Tuesday. Yesterday UNG attempted to break Tuesday’s highs, but was met with selling pressure. UNG is now trading between the 20 and 50-day Moving Averages. A break above the two-day high would provide a logical entry point for UNG. We are monitoring this ETF closely.

The market is likely at a crossroad. There is convergence of technical indicators across various timeframes that suggest a reversal is forthcoming. We are inclined to trade with extra caution and look to enter positions that are not heavily correlated to the market.
Deron Wagner is the Founder and Head Portfolio Manager of Morpheus Trading Group, a capital management and trader education firm launched in 2001. Wagner is the author of the best-selling book, Trading ETFs: Gaining An Edge With Technical Analysis (Bloomberg Press, August 2008), and also appears in the popular DVD video, Sector Trading Strategies (Marketplace Books, June 2002). He is also co-author of both The Long-Term Day Trader (Career Press, April 2000) and The After-Hours Trader (McGraw Hill, August 2000). Past television appearances include CNBC, ABC, and Yahoo! FinanceVision. Wagner is a frequent guest speaker at various trading and financial conferences around the world, and can be reached by sending e-mail to: deron@morpheustrading.com.
DISCLAIMER: There is a risk for substantial losses trading securities and commodities. This material is for information purposes only and should not be construed as an offer or solicitation of an offer to buy or sell any securities. Morpheus Trading, LLC (hereinafter “The Company”) is not a licensed broker, broker-dealer, market maker, investment banker, investment advisor, analyst or underwriter. This discussion contains forward-looking statements that involve risks and uncertainties. A stock’s actual results could differ materially from descriptions given. The companies discussed in this report have not approved any statements made by The Company. Please consult a broker or financial planner before purchasing or selling any securities discussed in The Wagner Daily (hereinafter “The Newsletter”). The Company has not been compensated by any of the companies listed herein, or by their affiliates, agents, officers or employees for the preparation and distribution of any materials in The Newsletter. The Company and/or its affiliates, officers, directors and employees may or may not buy, sell or have positions in the securities discussed in The Newsletter and may profit in the event the shares of the companies discussed in The Newsletter rise or fall in value. Past performance never guarantees future results.
Charts created by TradeStation (tradestation.com).
© 2002-2010 Morpheus Trading, LLC
Reproduction without permission is strictly prohibited.


