ES had a profit-taking day for the first day of the week. Sideways under red for most of the day Monday and closed with very light volume
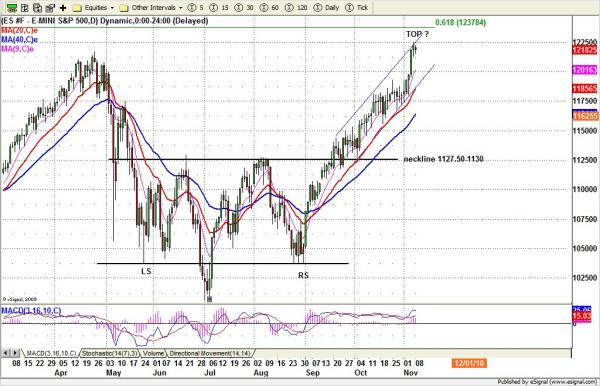
Today 1214-1216.50 will be the key range. As long as this range holds the price up, aggressive long term buyers will keep pushing price up again. But a big obstacle is the 61.8% retracement resistance level above the current price. Is ES close to its top? Maybe. It depends on the following two days move, and if ES can keep the upside momentum going or not. If not, ES is likely to do a correction first before it resumes marching up again.
There is another possibility: The bulls may manage to hold yesterday’s low, but be unable to make new highs. In that case it is likely ES will fall into a sideways move again like Monday.
To see more of Nat’s market analysis visit www.naturus.com. Free registyration required.
ESZ0 Daily chart
Trading strategy for Tuesday
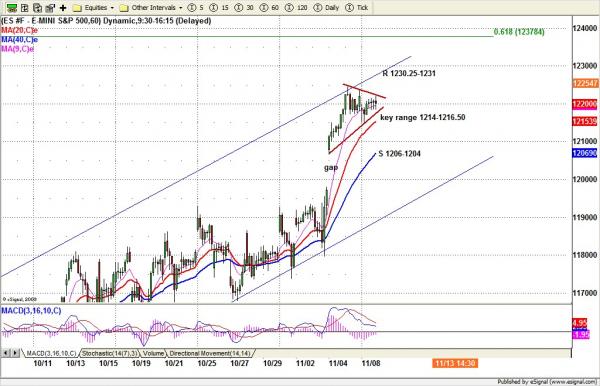
On the 60min chart, ES made a second narrow range again. A move above 1226.50 will lead price higher up to 1230-1231 range (short entry) or higher to 1237-38 range (short entry). A break below 1214.75 could start a stop run down to 1206-1208 range (long entry). If we see a strong gap down below 1200 it will be a bearish signal. It indicates that the previous three days movement could be an island pattern. The price could go down further to fill 1197.75 gap.
ESZ0 intraday – 60-minute bars