Our basic view is that the cyclical trend is in a sprint that should carry through into year end. We suspect that it will be a ‘white-knuckle’ ride for those with sufficient conviction to hold on to long positions.
Much of our work focuses on very long-term or macro themes. The problem with these kinds of perspectives is that they can be absolutely correct… give or take a year or three.
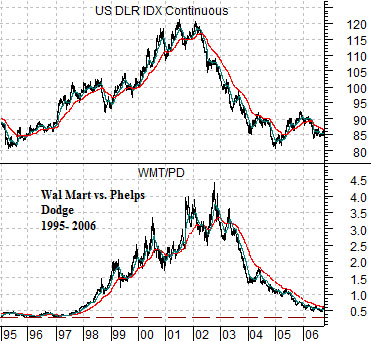
Below is a chart comparison between the U.S. Dollar Index (DXY) futures and the ratio between Wal Mart (WMT) and Phelps Dodge. PD was taken over by FreePort McMoRan back in 2007 but it served as an ‘anchor’ for many of our arguments for years and years.
Early in the previous decade our mantra on a daily basis was that we liked commodities and the commodity cyclicals. It was a lovely call ruined by the failure on our part to understand just how big a trend change we were dealing with.
The WMT/PD ratio shows how the markets tend to ‘bubble’ in one direction and then swing back to correct the excesses. The driver behind the strength in the consumer and financial stocks that elevated WMT was the U.S. dollar. Once the dollar finally turned lower the markets started to adjust relative prices as copper producer Phelps Dodge lifted upwards.
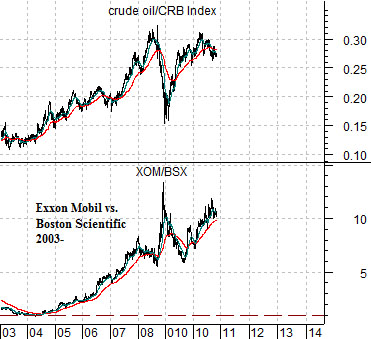
Next is a comparison between Exxon Mobil (XOM) and medical products maker Boston Scientific (BSX).
Our somewhat tenuous argument is that the XOM/BSX ratio has pushed higher in a manner similar to Wal Mart versus Phelps Dodge between 1996 and 2002. While the driver for the WMT/PD ratio was the dollar we are suggesting that the key for the XOM/BSX ratio lies with the ratio between crude oil and the CRB Index.
If the markets are going to shift away from the energy sector and back into some of the names that were left behind when crude oil futures prices rose to new all-time highs in 2004 then the key should lie with the relative strength for crude oil. From a macro perspective the weaker oil prices are on a relative basis the stronger our belief that new themes, new leadership, and new names are set to move into positions of prominence.
Equity/Bond Markets
Our interest in beating our heads against the wall with respect to Boston Scientific increased somewhat following this past Friday’s price gains. BSX showed just enough strength to pop above its 200-day e.m.a. line. This has marked rally peaks in the past (the chart below right shows that this is exactly how BSX topped out in January this year) so this one is going to take some further observation.
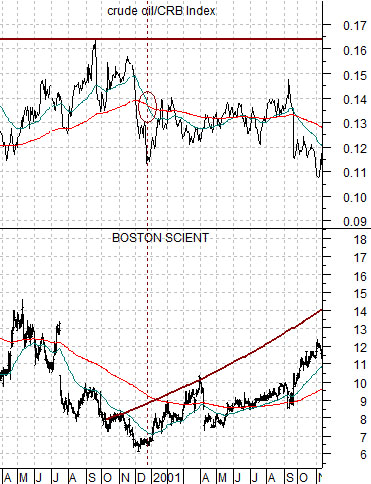
The chart below compares BSX with the ratio between crude oil and the CRB Index from 2000- 2001.
The argument has been that the trend for BSX turned positive in late 2000 as the 50-day e.m.a. line for the crude oil/CRB Index ratio crossed down through the 200-day. The crossing of the moving average lines actually marked THE bottom for BSX so we have been following this comparison somewhat closely this year.
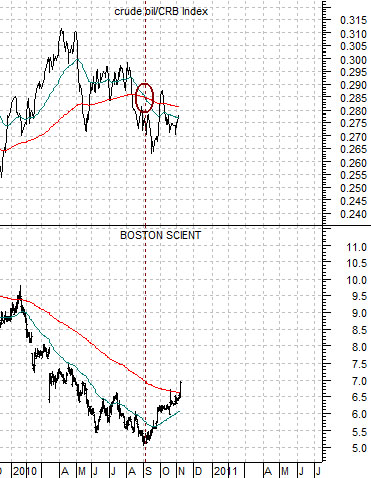
The next chart below features the same two charts. The point is that the moving average lines ‘crossed’ around the start of September at THE bottom for BSX.
Obviously oil prices have been somewhat stronger but it helps to look at this relationship from the ‘other side’. Instead of arguing that BSX will rise when oil prices weaken it may make better sense to suggest that the trend for oil prices is weakening as long as the share price of BSX is trending upwards. We imagine that this will take a rather lengthy amount of time to prove out but for now we are encouraged in our view that energy prices are still weakening on a relative basis.
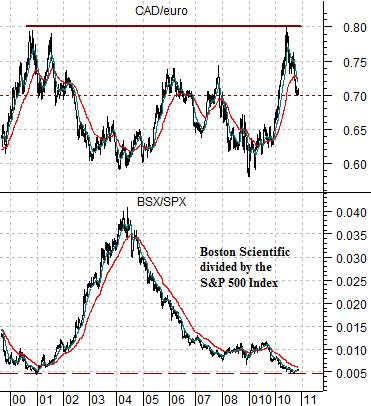
Last is a chart comparison between the ratio of BSX to the S&P 500 Index and the cross rate between the Canadian dollar (CAD) and euro. The chart suggests that while the CAD/euro could rise back to the highs near .80 in a manner similar to 2001 as long as the BSX/SPX ratio is trending upwards there is an offsetting downward trend for the commodity currencies versus the euro.