The S&P 500 cash index (SPX) closed at 1183.08 on Friday for a net weekly gain of 6.89 points, about 0.5%.
The noise about QE2 brought many sidelined investors back into the market last week and bullish sentiment (AAII) reached 49.62%. This high optimism holds the potential for a trend reversal; when all the buyers are already in, there is little upside potential left.
Technical analysis
The SPX has rallied for 8 weeks. But last week it struggled to make new highs; the upside breadth and momentum lagged in comparison to previous weeks.
Evidence is accumulating that the uptrend is closer to ending than continuing. Rallies in the S&P very rarely run for more than 9 weeks without a 3-5 week correction. We are now entering the 9th week of this rally.
If we look only at the pattern moves, the broad yearly range move could stop at the top area of the yearly consolidation range. On that basis, the price may stop rallying anytime.
But there are other considerations that suggest higher targets:
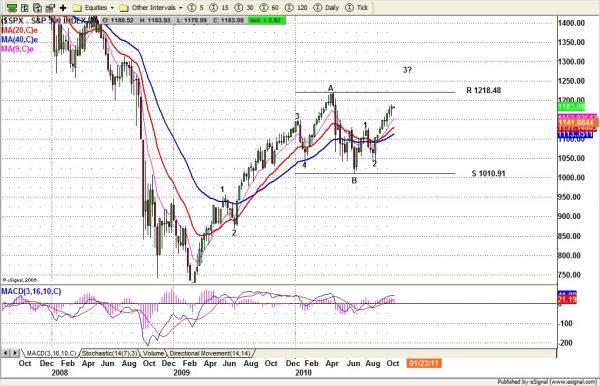
- Based on weekly wave moves, the SPX is in wave 3 of C. Usually wave 3 extends the furthest and takes the longest to complete. If this wave count is right, the price should go higher to 1218 -1245 range before wave 3 ends.
- The Fibonacci retracement could reach 1233 which is a 61.8% retracement from the 2009 low. This is a major resistance level.
- The chart is showing a short-term inverted H&S pattern with a final target zone around 1218.48-1247.57.
It is not clear that the price will reach those targets; but if the market moves into those zones, we have to watch for a big profit taking move in those areas.
Watch the way the price of Gold moves in the early part of the week; that may be an indicator of the way the markets will behave. Lots of uncertainty lies ahead of us.
Monthly resistance 1210 and support 1100; Weekly resistance 1200 and support 1150
SP500 e-mini projections
To see Nat’s detailed trading strategy visit www.naturus.com. Free registration required.
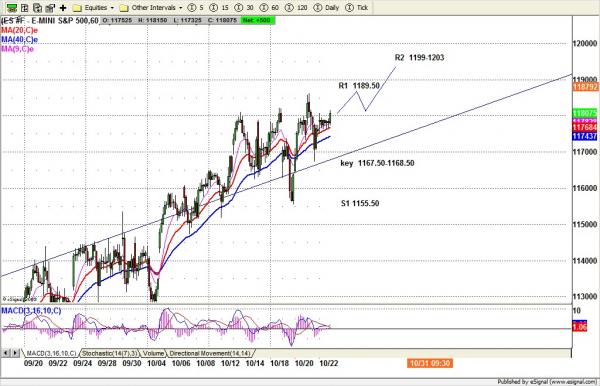
The ES broke the neckline of the inverted H&S pattern. So far that neckline 1127.50-30.00 is holding price up quite well.
The previous major rally lasted 55 trading days from February to April. Major market movements are often symmetrical, which would put the ending date of this rally around Nov 8 -12, which is uncomfortably close to both the expected date of a Fed announcement around Nov. 3, and the U.S. election. Unexpected outcomes from either of those events would drag the market down.
The 9-day moving average line has acted as the buying level since the big gap-up opening on September 1. If this moving average continues to support the price, we may see the market continue to move up inch by inch to make new highs. Only a break under 1155 will give a definite first indication that the uptrend is going to reverse
Monday October 25
Today 1186-89.50 remains the upside key line. A move above this key line will be bullish and price could move up to 1199-1203 (short entry).
A failure to break this key line could send the price lower to retest 1172-70 or lower still to 1167-68 (the downside key line).
A move under 1165.75 could send price down to 1162-60 or lower to 1155.50-57.00 area for testing. Nevertheless, price shouldn’t go under 1155.50. If it does, the market may fall right off the cliff.