Oct. 13 (Bloomberg) — Treasury 10- and 30-Year securities erased losses after the Federal Reserve said it would purchase about $32 billion in U.S. debt over the next month as it reinvests mortgage-holding proceeds.
What we found interesting yesterday was what didn’t happen as much as what did happen. While the dollar continued to grind lower helping to support the commodity markets the bond market- after an initial decline- rallied back in price late in the day to hold the rising trend.
With the Japanese yen and gold prices still pushing upwards the failure to break support by the U.S. 30-year T-Bond futures argued that nothing much had changed. Intel’s share price rose towards the 20 level mentioned in yesterday’s issue only to close the day lower while the banks reversed early gains to end generally in the red.
In a sense what ‘did happen’ was more of the same while what ‘did not happen’ was any real indication of a change in trend.
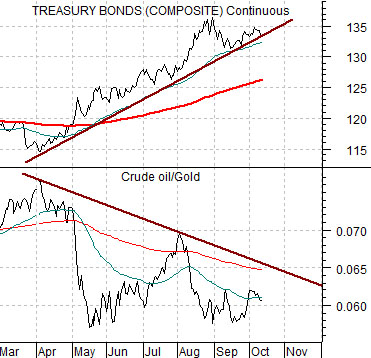
Below is a comparison between the U.S. 30-year T-Bond futures and the ratio between crude oil and gold.
The argument is that the crude oil/gold ratio trends inversely to the bond market. When crude oil is weaker than gold there is sufficient economic ‘slack’ to support rising bond prices. Even with energy price stronger in recent days the overall trend for the ratio remains lower.
So… the question is… if the TBond futures manage to break support today, tomorrow, or next week… what will it mean with respect to energy and gold prices? The easy answer would be that crude oil prices will start to rise at an even faster pace although it is also possible that the ratio could rise due to gold price weakness.
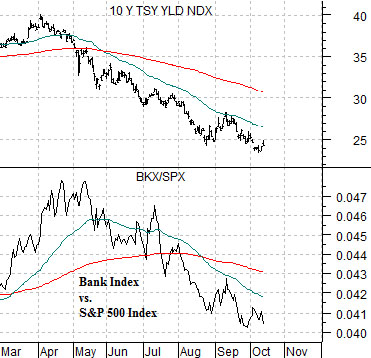
Next is a comparison between 10-year Treasury yields and the ratio between the Bank Index (BKX) and the S&P 500 Index (SPX). Our view has been that gold is the mirror image of the relative strength of the banks so as long as the BKX/SPX ratio is falling… yields should decline and gold prices should rise. Overall it was the lack of oomph by the banks and techs that really caught our attention yesterday.
Equity/Bond Markets
We haven’t focused on the gold miners for some time. Years and years ago when gold prices were plumbing the depths below 300 we did the gold miners almost on a daily basis. Today… not so much.
The question is… when would be a reasonable time to jump ship on the gold stocks? The answer is… some time after the ratio between copper futures and 10-year Treasury yields begins to crumble.
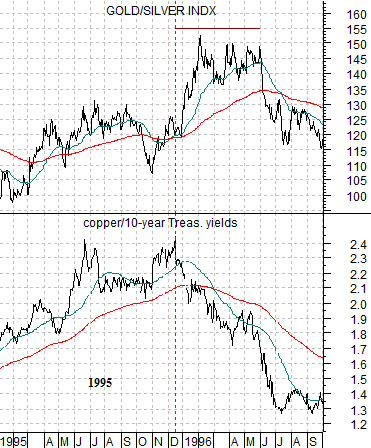
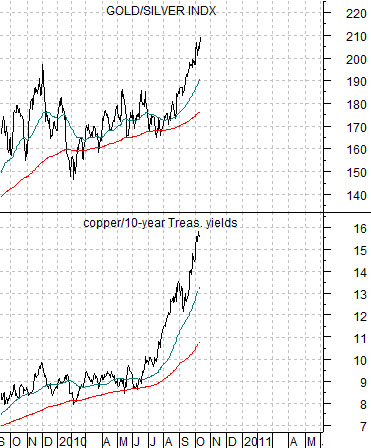
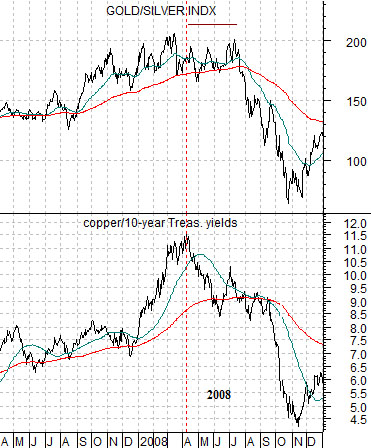
Below we have included three charts of the Philadelphia Gold and Silver Index (XAU) and the ratio between copper and 10-year yields. The chart at top right is from 1995- 96, the chart below right from 2007- 08, and the chart below from the current time period.
In 1995- 96 the copper/yields ratio made two peaks before breaking down below the 200-day e.m.a. line. Notice that the gold mining stocks remained near the highs for the next five or so months. Ideally, however, when the copper/yields ratio broke the moving average line it was about the right time to sell the gold miners.
In 2008 the copper/yields ratio made a peak in April before declining through the moving average line around mid-year. Once again the gold mining stocks held near the highs for a few months before breaking lower.
The current situation is interesting because it would take weaker copper or much stronger yields to pull the ratio lower. At present it is so far above the moving average lines that it is difficult to have a negative view on the gold miners. It is possible if yields start to soar that we are at the top for the XAU but if history were to repeat it will still be a few months before a negative trend starts to develop.