
ES still has trouble near the January high area. “Good” economic reports drove the price up to 1153.50 in the early morning session, but the ES made a quick U-turn into negative territory by the middle of the day. This kind of price behavior could be related to end of month repositioning. But it could also be the first warning signal that the trend reversal is on the way.
The monthly closing price gives a confirmation that the September breakout is real. If today’s closing price is under 1123, it indicates that a small down correction has resumed and could later retest the 1100 psychology support area.
Trading strategy for Oct. 1, 2010
ESZ0 intraday – 60-minute bars
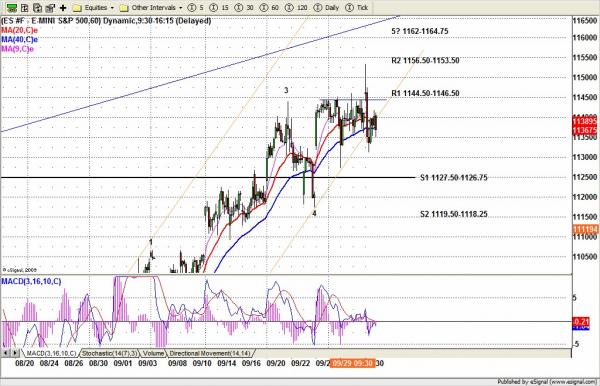
On the 60min chart ES had a thrust peak move in the early morning yesterday. Today that high should not be reached if the small downside correction has started.
The 1134.50 line is key today. A move under it indicates 1129-26.50 or lower to 1119.50-1121 (long entry) could be retested. Holding above 1134.50 could mean ES still wants to challenge 1144-43 one more time.
If 1144-43 range holds the ES down and if we close below 1123 line we will believe the uptrend is reversing. Otherwise there is a chance we will reach yesterday’s high 1153.50-1156.50 (short entry) again before the pullback movement occurs.
To see more of Nat’s market analysis, and the outcome of her calls, visit www.naturus.com. Free registyration required.

