We are going to cover an important point today. Not, of course, that all of our points aren’t important but we suspect that getting this one in particular ‘right’ is going to be crucial to one’s mental and financial well being.
The ‘fine line’ mentioned above has to do with the balancing act between the ‘decade theme’ and the ‘2-year lag’. The ‘decade theme’ argues that we reach a peak for cyclical asset prices in the first year of each decade followed by a negative trend that runs well into the ‘2’ year. In other words an asset price peak in 2010 followed by a bear market bottom towards the end of 2012.
The ‘2-year lag’ suggests that the trend for interest rates two years previous is impacting cyclical asset prices today. Given that yields were falling through all of 2008 we have argued that the cyclical trend will remain positive into year end.
Is it possible to marry the two themes into one thesis? Our view is not only that it is possible but also that it is going to be critical to find the correct balance. Hence… our admonition that today’s point is indeed important.
Let’s start off with the premise that the bond market is always ‘right’. It is especially ‘right’ when the trend for the bond market makes absolutely no sense.
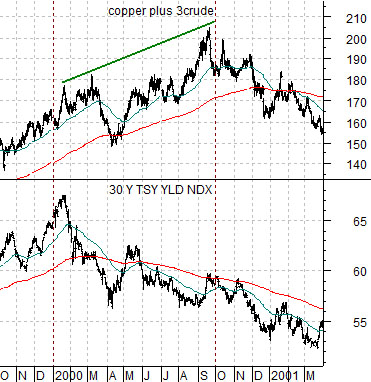
Below is a comparison between 30-year Treasury yields and the sum of copper (in cents) and crude oil futures (in dollars times 3) from the autumn of 1999 through the first quarter of 2001.
Notice that yields began to decline 9 or more months BEFORE copper and crude oil prices (representing the cyclical theme) finally turned lower. Falling yields preceded the peak for the cyclical trend in 2000 by at least 3 full quarters.
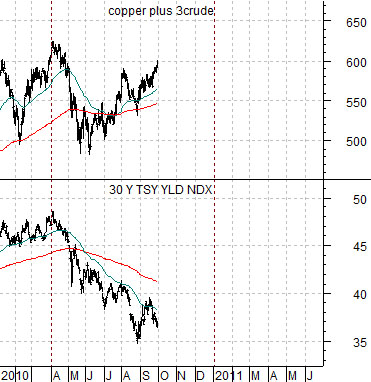
The next comparison shows the current situation. If we accept that the bond market is ‘right’ then we can see that yields have been falling for 6 months even as copper and crude oil prices continue to resolve higher. The markets are saying- in a manner almost identical to 2000- that cyclical growth is slowing (i.e. yields are lower) even as cyclical asset prices (copper and crude oil) push upwards.
Equity/Bond Markets
If we take the first page comparison literally then the trend is about 3 months ‘behind’ that of 2000. In other words yields turned lower in January of 2000 with the cyclical trend turning negative around the start of the 4th quarter. This year yields turned lower in April suggesting that the cyclical trend will remain stronger through year end before weakening during 2011.
How does this fit in with the 2-year lag? Actually… it fits very nicely.
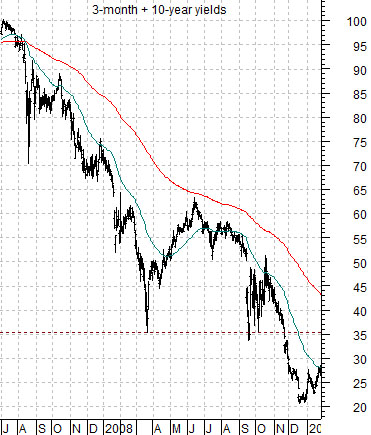
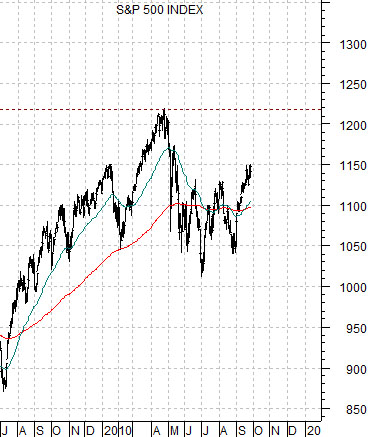
Below is a chart of the sum of 3-month and 10-year yields from July of 2007 into January of 2009. Below right we show the S&P 500 Index from July 2009 to the present day.
The 2-year lag ‘say’s that the cyclical trend should remain positive until roughly two years AFTER yields reach a major bottom. Given that yields reached a low in December of 2008 that puts the peak for cyclical asset prices somewhere around the end of this year.
The point is that based on the ‘decade theme’, the lag between the peak for cyclical asset prices and the start of falling long-term yields, and the ‘2-year lag’ the trend should remain positive through the next three months.
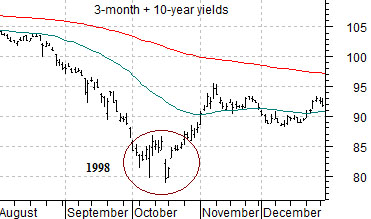
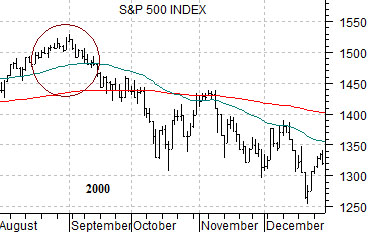
The problem is that there is often a difference between the ‘cyclical trend’ and the S&P 500 Index. To explain we have included the sum of 3-month and 10-year yields from 1998 and the SPX from 2000 below. Notice that yields bottomed in October of 1998 while the SPX reached a final peak around the end of August in 2000. While the equity markets remained stronger for ‘almost’ two years following the low point for yields there is a difference between ‘almost’ and ‘exactly’. In this instance the SPX started to weaken about a month and a half ahead of schedule…