
 Congratulations to 440,000 of us!
That’s how many people became Millionaires in the past 12 months (ending in June). According to a new survey from Phoenix Marketing International’s Affluent Market Practice, the number of American households with investible assets of $1 million or more rose 8% in the 12 months ended in June. The survey says there now are 5.55 million U.S. households with investible assets of $1 million or more. That follows two years of declines and brings the millionaire count back to 2006 levels. Of course, that is still below the peak of 5.97 million in 2007 and the current growth rate is well below pre-financial crisis levels, when the millionaire population increased as much as 35% a year.
Still, the numbers offer further evidence that the wealthy may have decoupled from the rest of the economy. The study’s authors say high salary growth, rather than investments, are the main drivers of the millionaire expansion but, as we are painfully aware, $1M in assetts doesn’t leave a lot of room for investments. The very wealthy, on the other hand, had a much better year than the mere millionaires. The population of American households with $5 million or more in investible assets surged 16%. The population of those with $10 million to invest increased 17%. The rich have never been getting richer than they have been in 2010!
 Of course, in order for someone to get rich, someone has to get poor and, this year it took 4M Americans falling below the poverty line ($22,000 for a family of 4) to raise the bar for our 440,000 winners. That’s pretty much right in line with the numbers I’ve been citing over and over again – it takes 1,000 poor people to make one rich one!
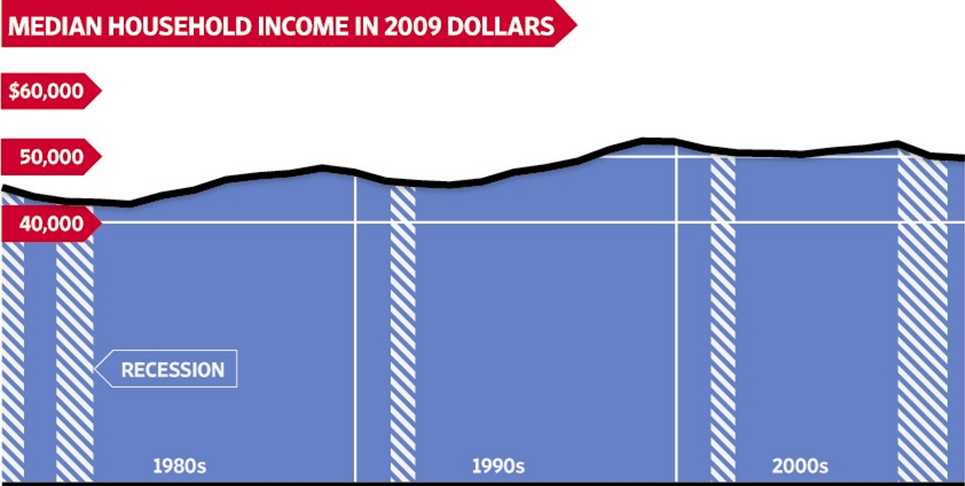
The Census Bureau found that the fraction of Americans living in poverty rose sharply to 14.3% in 2009, up from 13.2% previously. This is the highest level since 1994. In total, 43.6 million Americans were living in poverty last year. Even the median family is getting the shaft in America with 2010 inflation-adjusted salaries barely keeping pace with 1980 inflation-adjusted salaries – making 3 decades without improvement for the average American. According to the WSJ, the bottom 40% have dropped from having 14.5% of the nation’s income in 1980 to having 12% in 2010, a 30-year decline of 17.3% while the top 5% gained 31%, with their share of the Nation’s wealth rising from 17.5% to 21.7% of all income.
Where did the…

