We have mentioned the autos and airlines for quite some time so we thought we would go back over one of the key ‘drivers’ today.
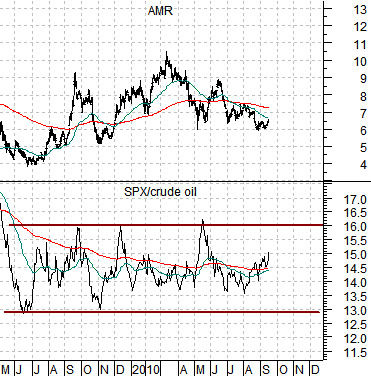
Below is a comparative chart of the share price of AMR and the ratio between the S&P 500 Index (SPX) and crude oil futures.
The argument is that a positive trend for the airline shares will tend to include a rising SPX/crude oil ratio. In other words as long as the equity markets are trading up and down WITH crude oil instead of rising on energy price weakness the airline stocks will tend to be somewhat moribund.
The SPX/crude oil ratio has essentially flat lined between 13:1 and 16:1 since the middle of 2009. This depicts a situation where the equity markets are rising or falling at roughly the same pace as energy prices.
A time will come when the equity markets start to lift in response to energy price weakness or, perhaps, rise even with flat crude oil prices. Based on the SPX trading close to 1130 it would take crude oil prices below 70 to push the ratio up through the 16:1 channel top. In the mean time AMR appears content to trade back and forth within a fairly narrow range around the moving average lines.
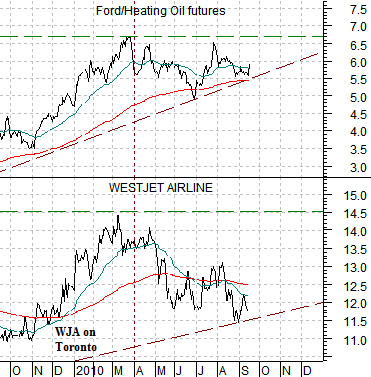
Below is a comparison between Canadian airline WestJet (WJA on Toronto) and the ratio between Ford (F) and heating oil futures.
We argued way back in early 2009 that the recovery trend should include a steady rise in the Ford/heating oil ratio. The energy ‘users’ versus energy ‘prices’ ratio was expected to resolve higher over time and is fairly close to the same trend exhibited by WestJet.
The Ford/heating oil ratio reached a peak at the end of the first quarter this year and has spent almost six months working through a consolidation. We noticed just enough strength in Ford and weakness in energy prices yesterday to bring this particular ratio back to mind. Our thought was that as we push through into either the fourth quarter of this year or, perhaps, the first half of 2011 we could see new highs for the ratio which would indicate that the markets are now ready to resume the advance. In the days to come pay attention to the relative action between the S&P 500 Index and crude oil futures prices because this is a trend that has largely been out of favor for a long time.
Sept. 16 (Bloomberg) — The yen fluctuated against the dollar near a two-week low reached yesterday when Japan’s first sales in foreign-exchange markets since 2004 sent the currency tumbling the most in 22 months.
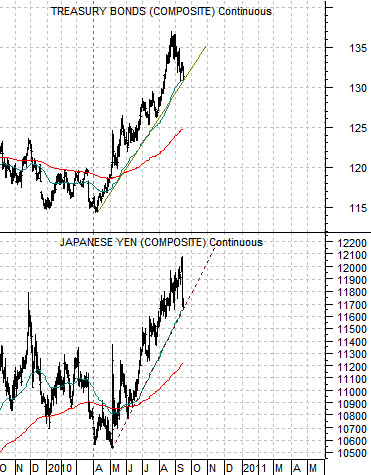
We are finally going to turn our attention to the Japanese yen given that there is a broad relationship between yen intervention and the trend for the long end of the bond market.
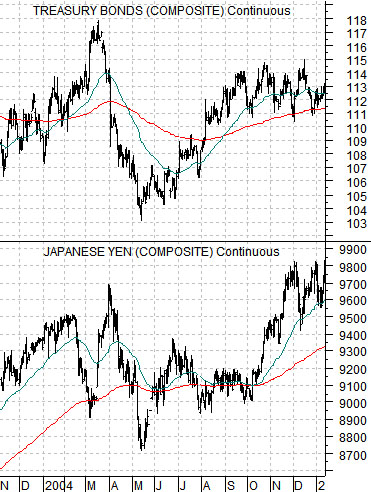
As noted just about everywhere in the financial press Japan sales of the yen this week marked the first intervention since 2004. Between January and March of 2004 rather massive quantities of yen were sold to stem the rise.
Below is a comparison between the Japanese yen futures and the U.S. 30-year T-Bond futures from 2004. Notice that the initial sell off in the yen in February of that year led to higher prices until the bond market finally turned down in price. Once bonds started to rise in the summer the yen was eventually dragged back up to new highs.
The point? Intervention may succeed but only if the bond market weakens concurrently.
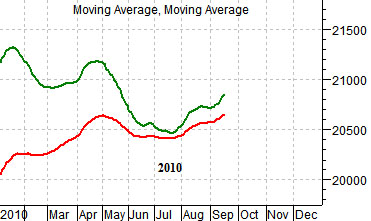
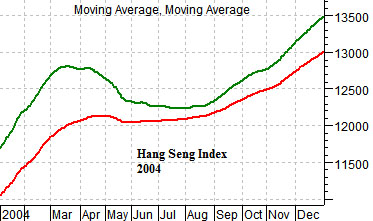
Below are two charts of the Hang Seng Index using two moving average lines (200-day e.m.a. in red, 100-day e.m.a. in green). The bottom chart is from 2004 while the upper chart is from 2010.
In both 2004 and 2010 the post-recession recovery was in doubt as the Hang Seng Index corrected lower to the point where the moving average lines converged. In 2004 cyclical growth kicked back into gear as the Hang Seng Index rose away from the moving average lines. The current situation so far is quite similar with a bullish outcome likely if the Hang Seng Index continues to push higher.