The S&P 500 cash index (SPX) closed at 1104.51 on Friday, covering its losses from the previous two weeks, and kicking off the month of September with a solid three-day rally. It added 3.7% for the week.
This week we have a rollover day on Thursday and volatility will continue to increase as we approach the rollover. If economic reports are better than expected this week, watch for a further rally.
Technical analysis

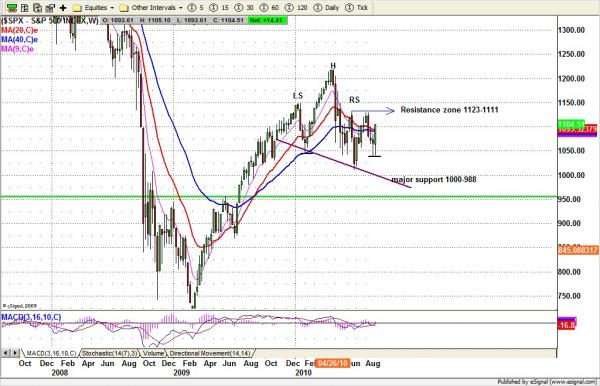
The SPX failed to breakdown the horizontal neckline of the weekly H&S pattern last week. Instead it moved back up sharply. So far the monthly broad consolidation range (1040-1130) remains intact. The question is whether SPX can have another rally week or just go sideway for two or three days, then fall back around horizontal neckline again.
The signals are mixed. The advance/decline ratio was strong — it reached a high of 10:1 — and the price broke above and closed above the 20- and 40-week moving averages, which will likely act as support lines for this week.
Second, there is clearly a potential inverted H&S pattern forming on the weekly chart, with the neckline lying around the 1130 area. If the price holds above 1070 this bullish pattern will encourage last week’s bulls to stay in this market hoping to see the price reach the 1130 area.
But the market volatility index (VIX) declined below its 20 moving average line. Even though it hasn’t given a sell signal yet the price is close to its major support level. If $VIX decided to rally, there is a big chance the SPX will fall back again, which could form a pattern similar to the Aug 10 move.
Monthly resistance 1150 and support 1000; Weekly resistance 1130 and support 1085
S&P 500 E-mini futures (ESU0)
Daily chart

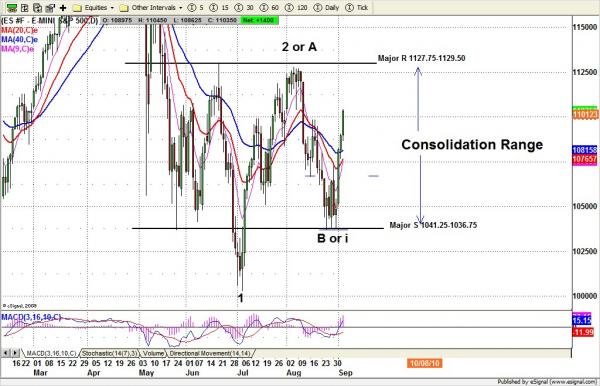
ES moved in tandem with its big brother the SPX last week. It looks more likely we will see a C move instead of the declining wave 3. But we can’t eliminate the second possibility completely. Because Sept. 9 is rollover contract day, the September contract value will move close to the SPX cash price, and we (along with the rest of the market) will begin trading the new December contract. Our CIT day will be on Sept 11.
Today (Tuesday) we may see a consolidation move in the early morning session, followed later in the session by another attempt to move higher to shake out weak bears.
The major key level is 1113.75 -1115.75 range. If ES stays below this range for Tuesday and Wednesday, and we have a gap down open below 1086.25 on Wednesday or Thursday, there is a big chance ES will resume the declining wave 3. A breakout above 1120 will eliminate the possibility of a declining wave 3 entirely. In that case the C top around 1135-1137 will be the upside target.
Trading strategy for Sept 7, 2010
ESU0 intraday chart – 60 minute chart

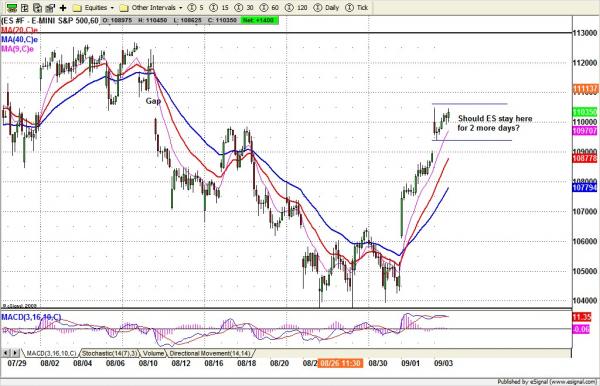
Last Friday, ES gaped up strongly on the open due to a better than expected non-farm payroll report. Today we are likely to see a sideways move within last Friday’s range. But if any breakout move occurs, these are the possibilities we envision:
- A move above 1106.50 could push ES up to 1109.25-1110.50 range or higher to 1115.50-1117.75 range (short entry).
- A move under 1093.75 could get last Friday’s gap fill at 1089.50 or little lower to the 1086.25 area (long entry).


