Bulls returned big time on the first day of September. The ES gained more than 30 points in a strong trend day.
Based on the daily chart, the short term low has been posted. It is unclear if that low at 1037 is a B low or the first wave low of declining wave 3. The 1105-1110 range is the key to determining which it is.
If ES stays below that key range, and the holiday ends with the market in an overbought condition, we will conclude 1037 is part of the declining wave 3 process. If we move above 1100-1105 today or tomorrow, ES is likely to move higher to form a C top above the A level.
The price behavior yesterday is similar to the move of March 6, 2009, which was the bottom of the sell-off. And given the U.S. election in November we can expect the administration — including the Fed — to do whatever it can to hype the market.
However the put/call ratio reached a low 0.72 yesterday, which was similar to the level on Aug. 24 when the current decline began. The ES has made a 50% retracement from the August high to low, a significant Fibonacci point, and closed barely above the 40-day ema. The volume was 96% up vs down on the market breadth index. Short-term sentiment is being pushed close to the overbought area. All of this could indicate a short-term top if we do not see a follow-through today and tomorrow.
The first testing level will be the 1085-92 range today. On a failure to breakout that range ES could have a pullback day to move down to the 1072-1070 or 1066-63 area to search for support.
TRADING STRATEGY FOR Sept 2, 2010
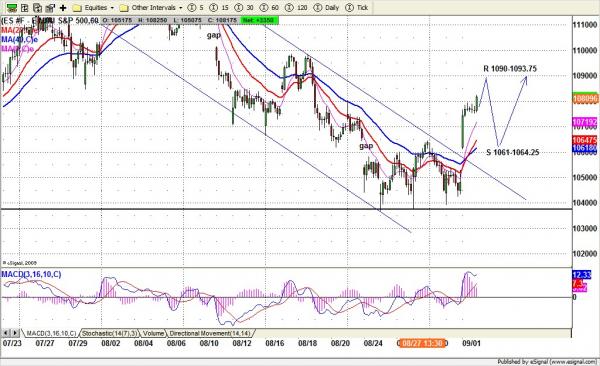
On the 60min chart, ES broke out the downtrend channel and made an abandoned baby move. This move should push price up to 1092 area. But there is also a chance for ES to move down to 1071-70 or lower to 1065-63.50 (long entry) if overnight trading can’t breakout through the 1083.50-85 range. Because the pre-holiday seasonal bias has two more days to run, a big decline under 1055 is unlikely. We still look for a pullback to go long for one more day.
ESU0 INTRADAY