
The next Change of Trend Date (COTD) was due as early as Friday with the formal COTD on the Monday the 23rd plus or minus a trading day. The market is ahead of us by a day, that’s fine the cycle mapping is still the same. In chart#1 below you can see how the combined cycles have traced out the first 7 1/2 months of the year relative to the real market (dow e mini line on close daily chart) stacked above it. By the middle of next week the cycle mapping is calling for a sharpe decline where traders should expect much more than a test of the mid July lows. Given Thursday’s decline, any rally from here should be turned back by the COTD top due Monday. An interim COTD low is expected on the 2nd of September.
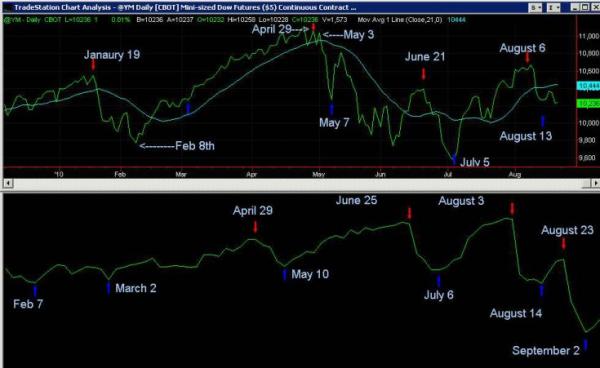
My leading indicator (MLI)- see chart #2 below- has given no signs of a reversal to the up side as of Wednesday. Since it is a leading indicator, the bearish outlook after the expected top on CODT is reinforced. In fact as the market has rallied in the last few days off its August 14th COTD low, the MLI was making a new near term low, a bearish sign. MLI’s last signal was a “sell” on August 6th. I will post its next buy signal the minute it happens.
Chart#2

To see charts in more details, follow this link.
Jack F. Cahn, CMT

