The markets continue to be pushed and pulled by two quite separate forces as investors attempt to get a sense of the economic recovery’s traction.
On the one hand… with short-term interest rates very close to 0% the market is inclined to arbitrage longer-term yields lower. In other words it makes sense to access almost free short-term capital and invest in longer dated maturities to earn the spread. Over time this flattens the yield curve by pulling long-term yields lower.
On the other hand… as the slack in the economic system slowly gets removed upward pressure on interest rates begins to build. From quarter to quarter- it would seem- the market has been shifting from pushing interest rates higher in anticipation of recovery and then dragging them lower to earn the positive carry.
A month or so back we noted that Goldman Sachs research expected that earnings for the S&P 500 Index would reach new all time highs in 2011. We also noted that following the post-Nasdaq melt down in 2000 earnings for the SPX did not reach a new peak until 2004. While our confidence in economic forecasts is usually quite low… we thought that this fit in quite nicely with a number of our views.
The argument has been that long-term yields bottom and turn higher very close to a year before the Fed starts to raise the funds rate. Given that long-term yields swung higher in mid-2003 with the first Fed rate hike taking place in June of 2004 the thesis is that new highs for SPX earnings in 2011 would be preceded by some kind of low for yields in 2010.
If our view is correct then we are already close to or perhaps past the cycle bottom for long-term yields. This is the argument that we have been making from any number of perspectives over the past few weeks. Since our views are not always correct… we thought we would show the other side of the equation- just in case.
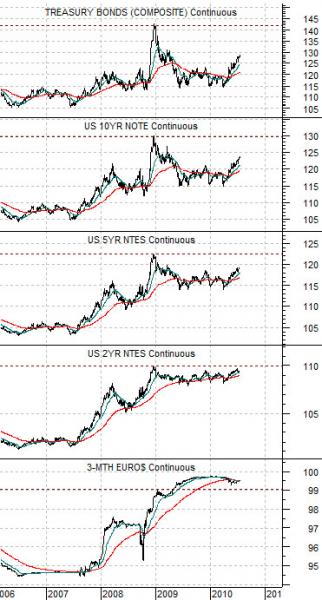
Below we show 3-month eurodollar futures, 2-year T-Note futures, 5-year T-Note futures, 10-year T-Note futures, and the 30-year T-Bond futures. Notice the way prices are slowly being ground towards the highs set at the end of 2008 with the 2-years already flirting with making new highs. Our focus on the following page will be on what could happen if the 2-years continue to rise in price.
Equity/Bond Markets
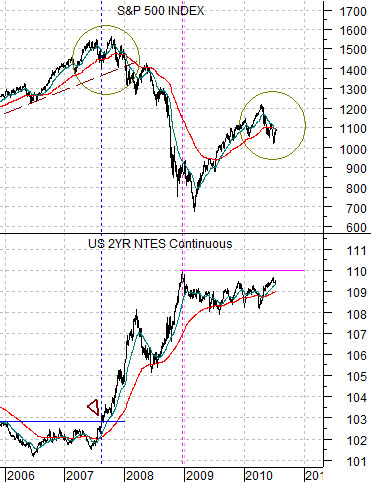
Below is a comparison between the SPX and the U.S. 2-year T-Note futures from 2006 to the present day.
Our initial focus is on what happened during the second half of 2007 as the 2-years broke to the upside.
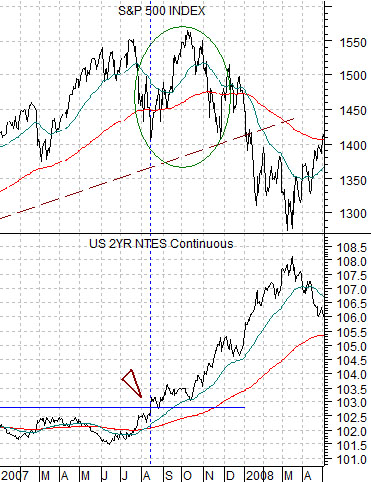
The chart below right shows the same comparison from 2007- 2008. Notice that the SPX declined sharply as the 2-years began to rise in mid-2007. The initial reaction was bearish for the equity markets as the 2-years moved upwards.
When the 2-years broke through resistance the equity market’s trend reversed with the SPX driving sharply higher for the next 2 or 3 months.
The point is that in 2007 the equity market declined on stronger bond prices and then surged upwards as bonds made new highs.
With the 2-years close to the highs set in December of 2008 we can see through the chart at right that the initial reaction during this year’s second quarter to rising bond prices was a hard decline in the SPX. From this perspective- and this is actually our point today- a case can be made that the stock market can rally this quarter for two completely different reasons. It can rally if bond prices decline (our view) and it can rally if bond prices make new highs (the 2007 example). Obviously the first outcome would lead to a more lasting recovery.
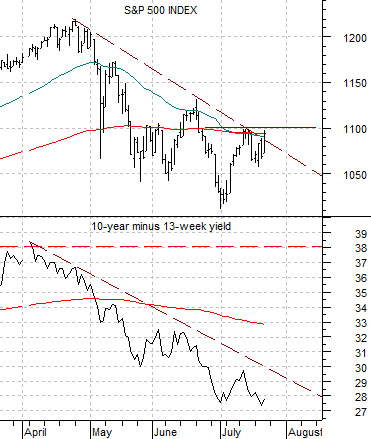
Quickly… below we compare the SPX with the spread between 10-year and 3-month Treasury yields. Our view has been that the SPX would rally once this spread bottomed and turned higher but the lesson from 2007 is that if the yield spread continues to grind lower even as the SPX moves back towards 1200 then are likely going to have to deal with a double-dip recession and much lower equity markets over the next year or so.