
 By: Evan Lazarus
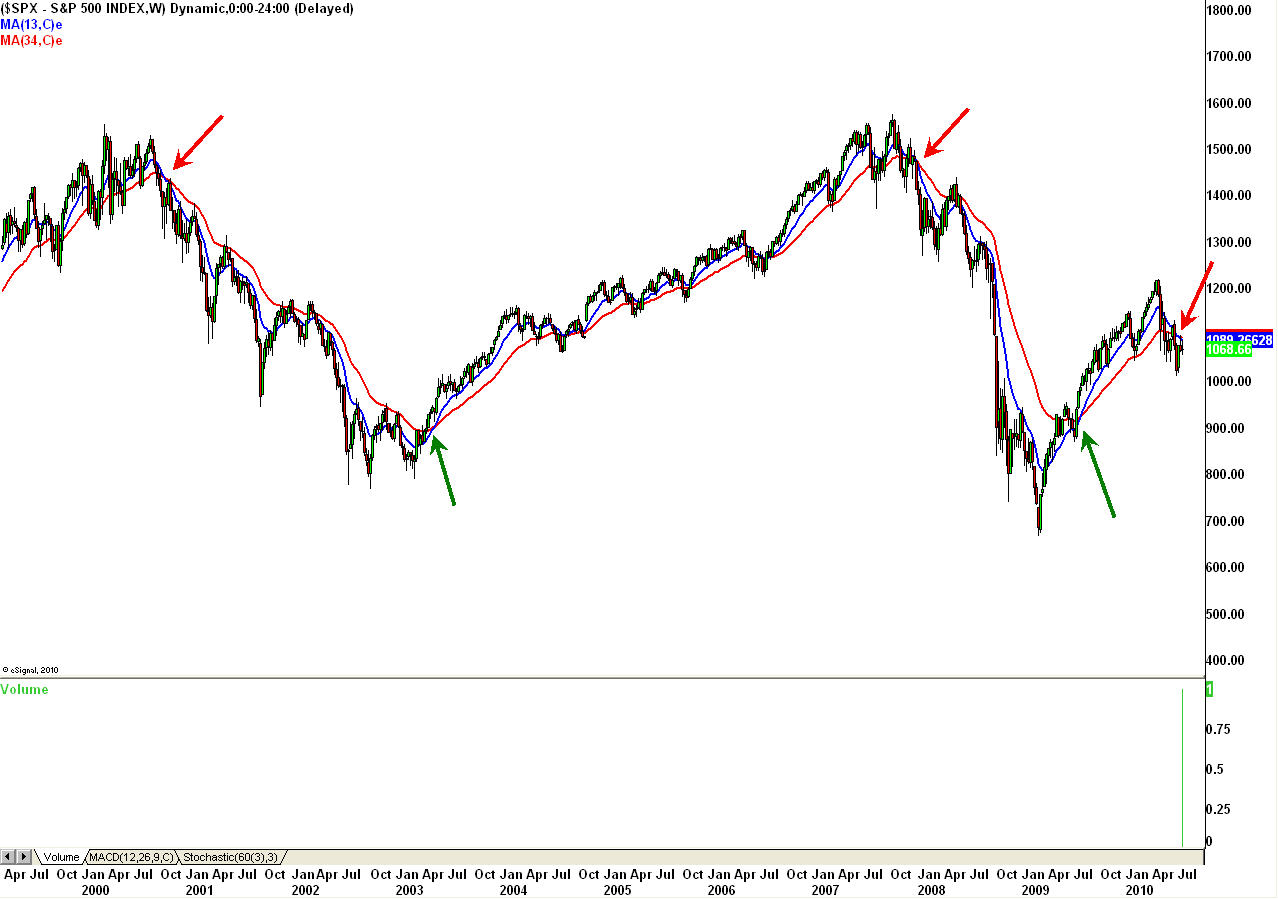
This weekly S&P futures charts highlights one longer term “investing” strategy that works well for those interested in putting money to work in their 401k or longer term portfolios with limited stress or effort.
This chart represents the last few years in the S&P’s and how using a 13/34 exponential moving average crossover on the weekly charts has worked well for catching longer term trends. This will never catch tops or bottoms but is usually good for 60-80% of a longer term move. We have recently seen a bearish cross as of a few days back which could signal the end of the bull run from the March 2009 lows and be a decent place to step in for what could be the start of a new downtrend.
This picture only represents a small segment of time but if you were to go back forty or fifty years, you would see how well this actually works with limited whipsaws.

