June 30 (Bloomberg) — U.S. stocks fell, extending the first quarterly drop in the Standard & Poor’s 500 Index in more than a year, after Moody’s Investors Service’s warning that it may downgrade Spain revived concern about sovereign debt and snuffed out an earlier rally.
June 30 (Bloomberg) — Gold rose, capping the biggest quarterly gain in more than two years, as signs of a struggling U.S. labor market and a fragile economic recovery stoked demand for the metal as a store of value.
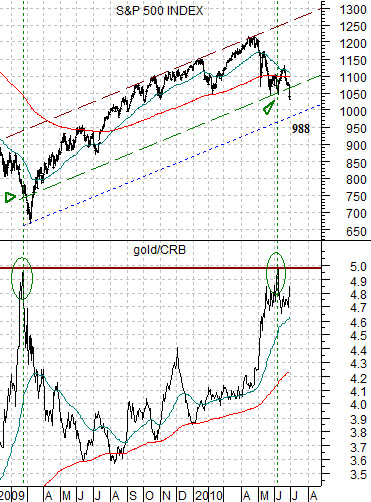
The premise today is that a rise in the ratio between gold and the CRB Index to around 5:1 in early 2009 marked the beginning of the end for the stock market’s decline. With the ratio moving back up to 5:1 in early June we could be the late stages of the current correction.
Below is a chart comparison between the S&P 500 Index (SPX) and the ratio between gold futures and the CRB Index.
In February of 2009 the gold/CRB Index ratio spiked up to just below 5:1. A few weeks later in early March the SPX finally pivoted back to the upside.
In early June the ratio made a second foray up to 5:1. On the chart we have run a green trend line through the closing levels for the SPX at the time when the gold/CRB Index ratio made both of its peaks.
The chart argues that as long as the gold/CRB Index continues to resolve lower then the base trend for the SPX is still positive even though support may not be found until somewhere at or just below the 1000 level.
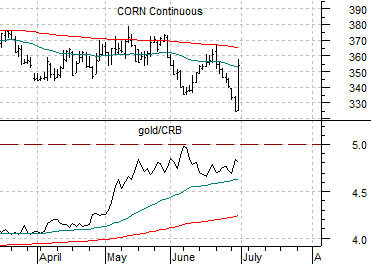
The key appears to be weakness in the gold/CRB Index ratio. Aside from an actual decline in gold prices this could take place through strength in sectors like the grains. The chart below right shows that corn futures were quite strong yesterday. Corn and wheat futures prices have reached the lowest levels relative to gold in decades.
Equity/Bond Markets
We are going to compare the current situation to two previous ‘one quarter’ crises.
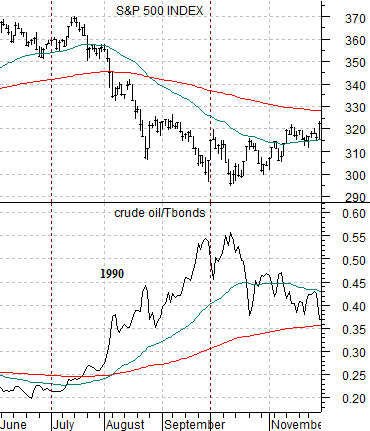
Below is a chart of the S&P 500 Index along with the ratio between crude oil futures and the U.S. 30-year T-Bond futures from 1990.
The offset to falling equity prices in 1990 was rising crude oil prices and weak bond prices. The SPX declined through the third quarter as the crude oil/TBond ratio pushed higher. Some time around the middle of October the trend reversed back in the other direction as equities and bonds recovered in the face of falling oil prices.
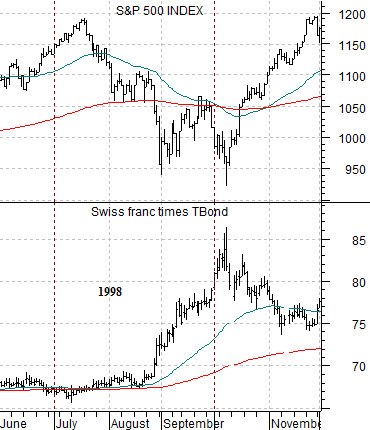
Next, we have a chart of the S&P 500 Index and the combination of the Swiss franc futures times the U.S. 30-year T-Bond futures from 1998.
During the Asian crisis equity prices declined as money moved rapidly into the long end of the bond market and the safety of the Swiss franc. The trend ran hard through the third quarter only to reverse early in October.
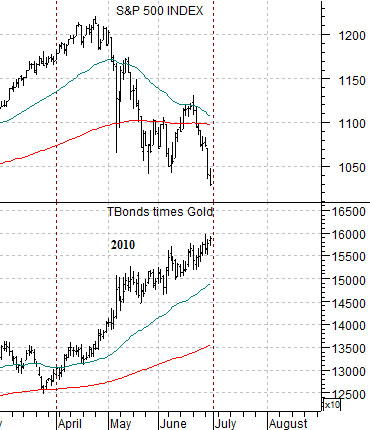
Lastly we feature the S&P 500 Index and the combination of the TBond futures times gold futures for the current time frame.
The bearish trend for equities during this year’s second quarter has gone with bond and gold price strength. The point is that we are unlikely to see a sustained recovery in the equity markets until the offsetting trend- strength in bonds and gold- shifts lower. The late day sell off in the SPX yesterday made sense given that bonds and gold were still holding near the highs for the day. When it is time for the markets to pivot look for confirmation of equity markets strength through equal weakness in bond and gold prices.