We should probably stop commenting on the price of gold given that it only seems to get us in trouble but… we won’t. Today we are not going to focus on whether gold prices have to go higher or lower but instead will show how the trend got to current levels in the first place.
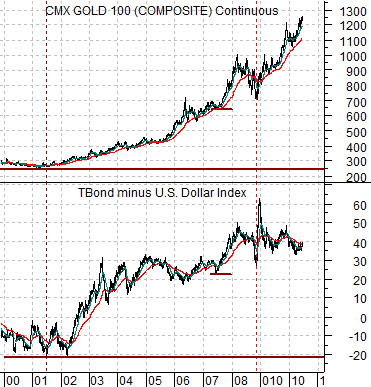
Below is a comparison between gold futures and the price spread or difference between the U.S. 30-year T-Bond futures and the U.S. Dollar Index (DXY).
The spread rises when long-term bond prices move higher or when the dollar trends lower. Conversely the spread will decline if interest rates rise or the dollar firms.
Back between 2000 and 2003 the price of gold was trading between roughly 250 and 300 while the TBond minus Dollar spread was bouncing between 0 and -20. In other words at the lows for gold the U.S. Dollar Index was as high or higher than the price of the TBond.
Fast forward a decade or so and we find that the expiring June TBond futures contract ended in the 124’s with the U.S. Dollar Index just below 86. Ten years of a strong bond market and weak dollar have helped to lever gold prices up from below 300 to over 1200.
Below is a shorter-term view of the same chart comparison.
Our thought is that while many investors are aware of the relationship between gold and the dollar (i.e. gold does better when the dollar is weaker) a much smaller percentage realize the importance of the long end of the Treasury market.
When bond prices are rising gold tends to outperform both copper and crude oil so any time money starts to flee risk by heading into the safety of the bond market gold prices tend to do better. On days like yesterday when the dollar ends a bit stronger while bonds are a bit weaker… the price of gold tends to decline so, in a sense, that is perhaps the best explanation that we can give for Monday’s 25 point decline in gold prices.

Equity/Bond Markets
The ‘Decade Theme’ argues that a major asset class peaks in price at the start of each new decade. Commodities topped out in 1980, Japanese stocks and real estate in 1990, while U.S. large cap stocks and the Nasdaq peaked in 2000.
The question is… if the cycle repeats… what asset class might be in danger of hitting a multi-decade peak this year?
From time to time we wonder whether the best answer is ‘bonds’. After a 30-year bull market and with short-term yields close to 0% we find U.S. consumers frantically deleveraging and reducing debt. A contrarian would take the other side of that trade by locking in debt for the longest time frame possible.
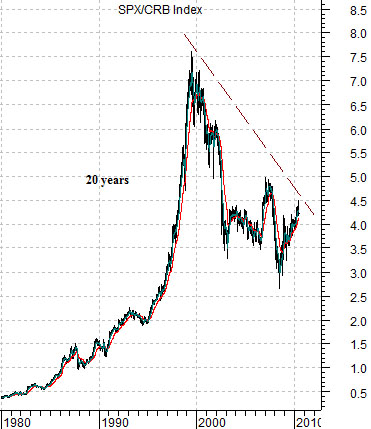
First below we show the ratio between the S&P 500 Index and the CRB Index from 1980 to the present time period. The ‘equity/commodity’ ratio rose for 20 years between 1980 and 2000 and was followed by a decade’s worth of ‘catch up’ by the commodities sector. Fair enough.
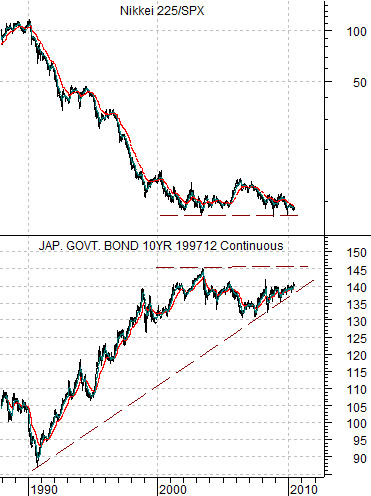
We then have a comparative view of the Japanese 10-year (JGB) bond futures and the ratio between the Nikkei 225 Index and the S&P 500 Index.
When Japanese bond prices are trending higher the Nikkei tends to weaken relative to the SPX. When Japanese bond prices are weaker in price the Nikkei outperforms. In other words the only time to consider owning Japanese stocks is when there is at least some chance of a weaker Japanese bond market.
The equity/commodity ratio (top right) trended higher for two consecutive decades. When commodity prices reached a bubble peak in 1980 twenty years passed by before commodity prices returned to relative strength.
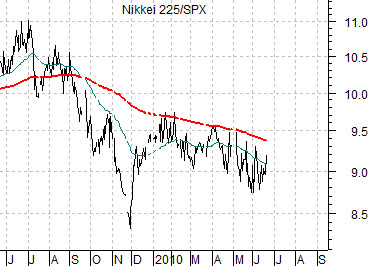
Our thought is that the Nikkei peaked twenty years ago and the offset has been a rising trend for the Japanese bond market. While the short-term trend (below) for the Nikkei/SPX ratio is still negative we can at least imagine a scenario where the ratio pushes nicely back above the 200-day e.m.a. line. If this were to happen some time this year then a case can be made that the asset class at risk of making cycle price highs in 2010 would be the bond market in general and the Japanese bond market in particular.


