June 2 (Bloomberg) — President Barack Obama said the Gulf of Mexico oil spill should send an urgent signal to Congress to complete work on energy legislation, including rolling back “billions of dollars in tax breaks” for oil companies and fostering investments in alternatives to fossil fuels.
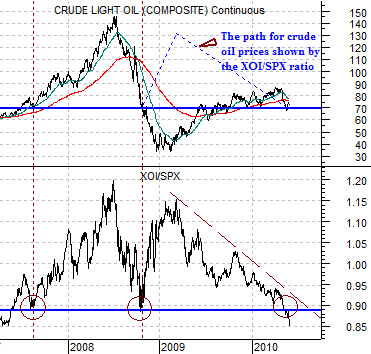
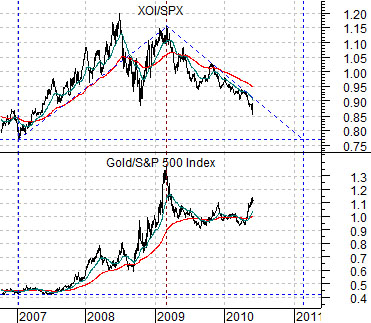
At top right is a chart comparison between crude oil futures and the ratio between the Amex Oil Index (XOI) and S&P 500 Index (SPX).
One of our views has been that the equity markets were leading crude oil. In other words instead of the oil stocks following crude oil prices- which makes intuitive sense- the opposite was actually the case as strength in the oil stocks led to rising oil prices.
The problem over the past year or so was that the trend for oil prices diverged rather markedly from the trend for the oil stocks. As the XOI/SPX ratio declined from the peak set in the spring of 2009 crude oil prices actually rose. The oil stocks were in a down trend even as crude oil prices appeared to be in an up trend.
Another argument was that an XOI/SPX ratio below .90 should go roughly with crude oil futures prices close to 70. Strangely enough as both markets approached from different directions… that is exactly what has happened.
Below right is a comparison between the XOI/SPX ratio and the ratio between gold and the S&P 500 Index.
The argument here is that the XOI/SPX and gold/SPX ratios follow the same trend which means that as long as the markets are moving away from the major oils the gold/SPX ratio should resolve lower.
If the trend persists the charts argue that the relative strength gains between 1997 and early 2009 for the XOI and gold should be effectively removed some time in early 2011 pulling the ratio between gold and the SPX back to somewhere below .50. If this proves to be the case then unless the SPX is somewhere north of 2000 we would have to expect gold prices to be lower a year from now. A relatively flat equity market would call for a decline in gold prices back into the 500- 600 range.
Equity/Bond Markets
We are going to return once again to the Decade Theme.
The argument is that cyclical growth in one form or another peaks at the start of each new decade and then contracts through the ‘2’ year. Recent examples include the double-dip recessions between 1980 and 1982, the collapse of Japanese asset prices in 1990, and the Nasdaq’s bubble top in 2000.
The problem is that the prospect of declining cyclical growth in one or more sectors suggests at the least the potential for a negative trend for the equity markets. Or does it?
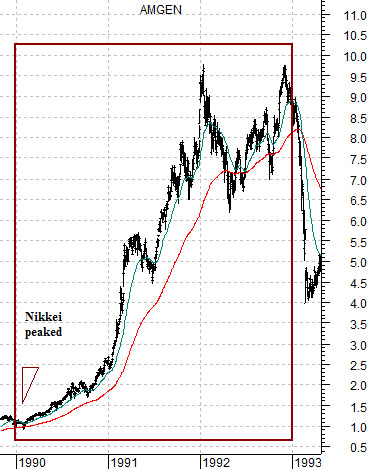
At top right is a chart of biotech giant Amgen (AMGN) from 1990 through into 1993. Through the cyclically weak time period between 1990 and the end of 1992 the share price of AMGN rose by close to a 1000%.
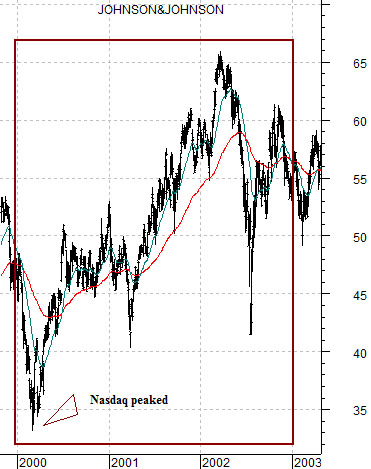
Below right is a chart of Johnson and Johnson (JNJ) from 2000 into 2003. As the Nasdaq collapsed pulling global equity markets into a bearish trend the share price of JNJ trended higher.
Our point has to do with ‘offsets’. Weakness in one sector can create strength in another. A lack of momentum in a number of major sectors focuses the flow of money into those groups that are still positive. If the Decade Theme repeats there should still be opportunities for asset price growth over the next few years.
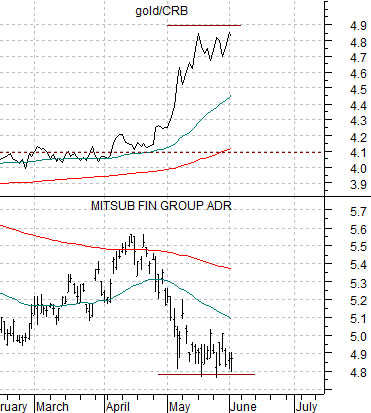
A few years from now this will all be perfectly obvious but at the moment we are still trying to figure out whether the end-of-decade asset price peaks were made late last year in the forex markets as the dollar bottomed or, perhaps, with gold prices this year. Our view is that the gold/CRB Index (shown below) should resolve lower as the equity markets recover. Our focus in terms of ‘the equity markets’ has been on lagging financials such as Mitsubishi UFJ (MTU).