
Price gaps are a very useful tool that way too many traders overlook. A gap occurs when a price bar opens and remains outside of the previous bars range. Gaps tend to provide significant support/resistance once they are formed.
There are 3 important types of gaps, a breakout, mid-point or continuation, and exhaustion. The type of gap that I am particularly interested in right now is the potential mid point that shows up on the daily S&P500 futures chart on May 20th. Continuation or mid-point gaps usually occur in the middle of a market swing and often can be used to measure the expected distance the trend will ultimately travel.
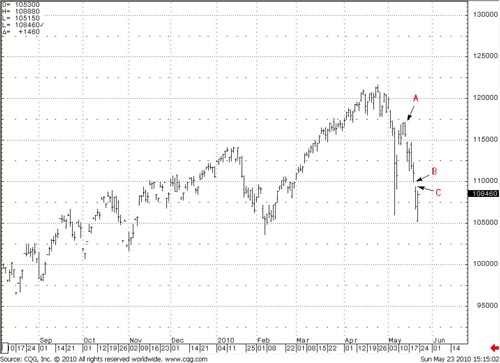
If this is a mid-point (and not an exhaustion) I would consider the move to have begun at point A on May 13th at 1171.70. From there the market fell to a low of 1099.00 on May 19th, at point B. A move of 72.70 points. The next day the market gapped lower forming a high at 1094.00 C , totally below the previous days range. In this case if you take the distance from the top of the markets initial move to the lowest low prior to the gap, and then subtract that from the high of the lower gap bar C, you get a projection of where price is expected to go. By using this as a measuring point we should expect a move lower to 1021.3.
The market “tested” the gap today but ran into stiff resistance at 1090.00 and summarily tanked. If market price cannot be breached above the 1094.00 level relatively soon, a move to the 1020.00 area is likely. Time will tell.

