
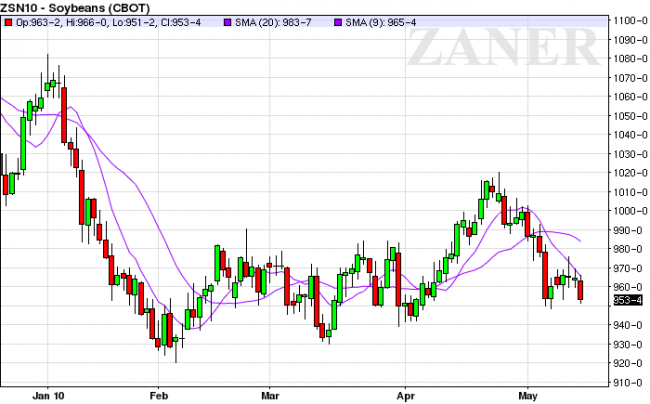
The Technical Indicators That I Use Are Telling Me That The Trend In Soybeans Is Down.
MY ANALYSIS
Fundamentally, SOYBEAN Futures could fall further due to a very strong U.S. Dollar Index, weak Equity Markets, and a plummetting Euro Currency.
Technically, we see the TREND is DOWN according to the 9 day MA and 20 day MA.
OPTIONS ON FUTURES AND COMMODITY OPTIONS INVOLVE SUBSTANTIAL RISK
OPTIONS PLAY
BUY JULY OR AUGUST PUTS ON THE CME
CONTRACT SIZE 5,000 BUSHELS
LEVERAGE FACTOR $.10=$500
We also buy in a 3 to 1 ratio an outright call to help hedge our trade in case the market makes a MAJOR move against us.
FOR OUR FREE CME REPORT ON OPTION BASICS CLICK HERE: http://www.zaner.com/3.0/mmck5.asp
WE ARE ALSO BUYING OPTIONS IN U.S. 30 YEAR TREASURY BONDS, SILVER, GOLD, SOFTS, and OIL.
Before you place anyu of these trades in your account you should call or email me with your phone number for a detailed explanation of the strategies 312-277-0115 or mmckinney@zaner.com.
FREE QUOTE-“Whether you think you can or think you can’t, either way you are probably right.”
For More Trade Ideas” http://www.mckinneytrading.blogspot.com/
Futures, options and forex trading is speculative in nature and involves substantial risk of loss. All known news and events have already been factored into the price of the underlying commodities discussed. The limited risk characteristic of options refers to long options only; and refers to the amount of the loss, which is defined as premium paid on the option(s) plus commissions.
FOR CUSTOMERS TRADING OPTIONS, THESE FUTURES CHARTS ARE PRESENTED FOR INFORMATIONAL PURPOSES ONLY. THEY ARE INTENDED TO SHOW HOW INVESTING IN OPTIONS CAN DEPEND ON THE UNDERLYING FUTURES PRICES; SPECIFICALLY, WHETHER OR NOT AN OPTION PURCHASER IS BUYING AN IN-THE-MONEY, AT-THE-MONEY, OR OUT-OF-THE-MONEY OPTION. FURTHERMORE, THE PURCHASER WILL BE ABLE TO DETERMINE WHETHER OR NOT TO EXERCISE HIS RIGHT ON AN OPTION DEPENDING ON HOW THE OPTION’S STRIKE PRICE COMPARES TO THE UNDERLYING FUTURE’S PRICE. THE FUTURES CHARTS ARE NOT INTENDED TO IMPLY THAT OPTION PRICES MOVE IN TANDEM WITH FUTURES PRICES. IN FACT, OPTION PRICES MAY ONLY MOVE A FRACTION OF THE PRICE MOVE IN THE UNDERLYING FUTURES. IN SOME CASES, THE OPTION MAY NOT MOVE AT ALL OR EVEN MOVE IN THE OPPOSITE

