
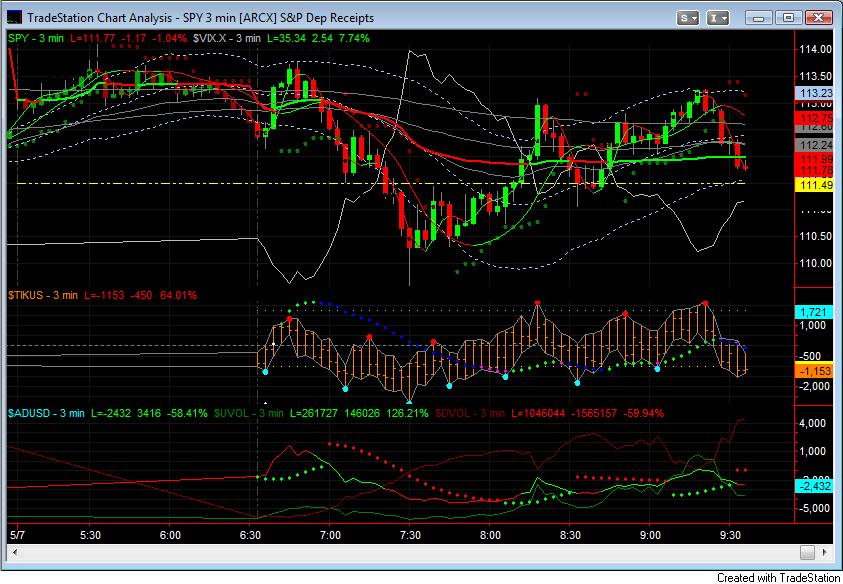
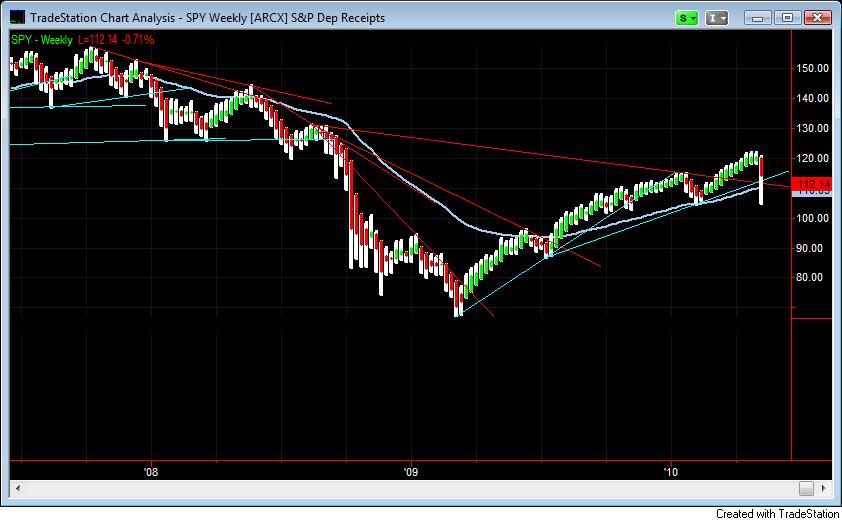
 The VIX is plus 7.5% as of the time of this writing. Markets are down roughly another one-percent, but trade is really running sideways for now and price was caught from its a.m. sell precisely at the S&P’s 200-dma. This happens to coincide with weekly bar technical support, as shown below:
 If your charting package does not display volatility adjusted range bars, you may consider reducing your time frame by 1/3 or more to better see the structure of these wide ranging bars.

