Thursday 29 April 2010
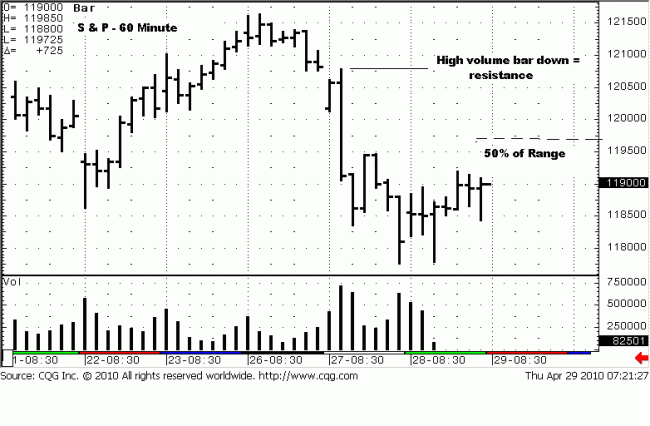
The single-most important bar right now is on the 60 minute chart. It is the
high volume bar that spilled to the downside when price broke on Tuesday.
That is where supply [sellers] entered the market in a big way and
overwhelmed demand [buyers]. It is more than a line in the sand. It is an
area where price will be defended by sellers, and buyers will have to overcome
that strong effort…if they can.
We also marked the 50% retracement area to act as a guide. If price
struggles to get past the half-way point, it will be another sign of weakness.
It comes in around the 1197 area, but keep in mind, it is only a guide, and it
represents an area, not an absolute number. Resistance becomes more
formidable as price gets above the 50% area to the high of the large sell-off
bar, 1208. If you look at the two bars just to the left of that high volume down
bar, the 2nd and 3rd bars to the left of it, you can see how price found some
support at that same 1208 level, just before finally caving in.
Yesterday’s intra day activity had a somewhat positive undertone. Note how
there was no downside follow-through after Tuesday’s rout of buyers that gave
way to sellers acting with impunity. The last three bars have upper range
closings, telling us buyers won the “battle of the bar,” and the 5th bar from the
end, a retest of the Tuesday low, also closed upper end. Buyers were present,
and we remain mindful that all corrections since the February low have been two
days, maximum, of lower lows.
What is key for today is to watch the caliber of any rally, today. If there are
signs of weakness, going short are the marching orders here, leaning against
Tuesday’s high of 1208. That is the plan. It is very simple, and now it is time
to work it.


