The premise of intermarket analysis is that trends in one market impact trends in other markets. Strong energy prices create pressures on energy ‘using’ sectors, a weak dollar supports commodity prices, financial stress leads to rising gold prices, weak base metals prices go with lower interest rates… and so on.
We tend to view the foreign exchange markets as gateways for the flow of capital. Money is continually flowing from here to there in search of higher returns or, at times, lower risk. If the trend is based on Asian or emerging markets growth then money will tend to move away from the dollar. If the trend is focusing on commodity prices then currencies like the Canadian and Australian dollars will be stronger while any theme that is anchored by emerging markets strength will typically include a rising exchange rate for currencies like the Mexican peso and Brazilian real.
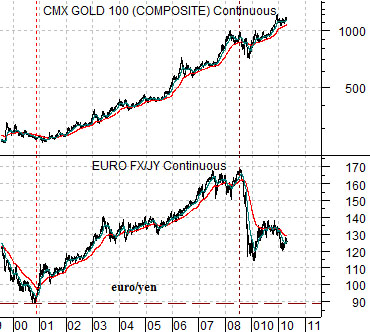
In any event… when the Nasdaq began to collapse in late 2000 the trend within the forex markets shifted. The chart at top right shows that the cross rate between the euro and Japanese yen began to rise along with gold prices.
While it may not be exactly fair to use gold prices for this comparison the basic point is that as long as the euro/yen cross rate (which tends to trend in the opposite direction of the U.S. Dollar Index) was rising the trend had not changed. From 2001 into 2008 there were any number of points in time when it seemed to make sense to head for the exits but month after month and year after year the euro/yen cross rate resolved higher.
After the markets collapsed in 2008 a new trend began to emerge. Instead of the euro rising against the yen in the face of a weaker dollar the flow of money shifted with the commodity currencies rising against the euro.
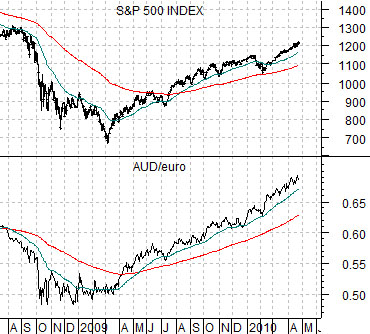
The chart below compares the cross rate between the Australian dollar (AUD) futures and the euro with the S&P 500 Index (SPX).
The points? As long as the AUD/euro cross rate is pushing higher the recovery in the commodity and equity markets should continue. While our view is that the AUD/euro cross rate is approaching a peak (page 3) the reality is that trends often run far longer than one expects. After all, the euro/yen cross tracked higher for 7 1/2 years!
Equity/Bond Markets
When a trend or theme dominates for a long period of time investors become enamored with it. One of the cardinal sins of investing relates to chasing the old trend. Profits can be made on the bounce, of course, although generally there is more money to be made in other sectors.
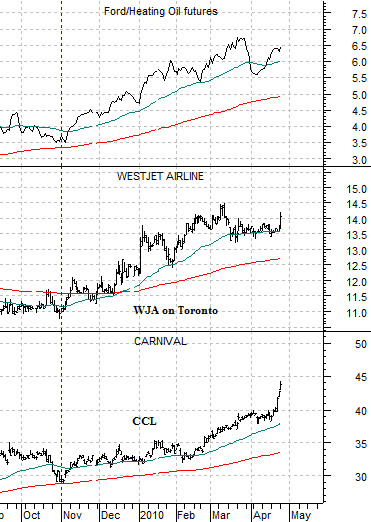
While many fixate on the potential for iron ore producers or steel makers to spring back to life or for the fertilizer companies to return to prominence the reality is that truly parabolic chart patterns are showing up in the consumer discretionary sectors. Netflix (NFLX) comes to mind along with Sotheby’s (BID) as examples. Another stock that has been leaping higher over the last week is Carnival (CCL) which we show at right along with Canadian airline WestJet (WJA) and the ratio between the share price of Ford (F) and heating oil futures.
The argument is that when the U.S. dollar began to rise back in November it removed some portion of the positive commodity markets trend. In other words… a stronger dollar led to a trend change within the markets as money began to flow from the oil producers over to the energy users.
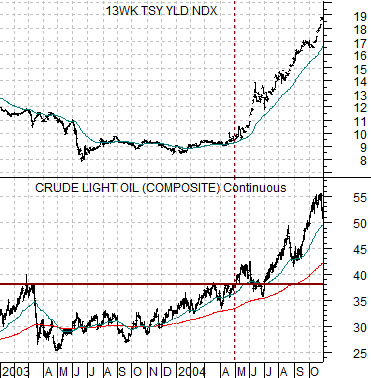
Below is a chart comparison between crude oil futures and 3-month U.S. TBill yields from 2003- 2004.
The idea here is that a break out to new highs by crude oil futures in the spring of 2004 initiated a chain reaction within the markets. Strong energy prices pushed short-term interest rates higher which, in turn, created a downward trend for lumber prices followed by the forestry stocks, home builders, and eventually the banks.
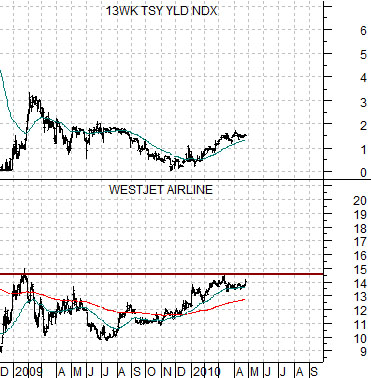
Our thought is that while everyone is watching energy prices in anticipation of crude oil futures reaching new all time highs the markets are creating new winners and losers. The chart of WestJet from 2009- 2010 looks a bit like crude oil back in 2003- 04. If TBill yields are going to push higher later this year it appears that it may be due to strength in the consumer discretionary and energy ‘user’ sectors.