This week, we’ll take a brief look at the energy sector in general and the hurricane based short-term trade as well as the year-end outlook.
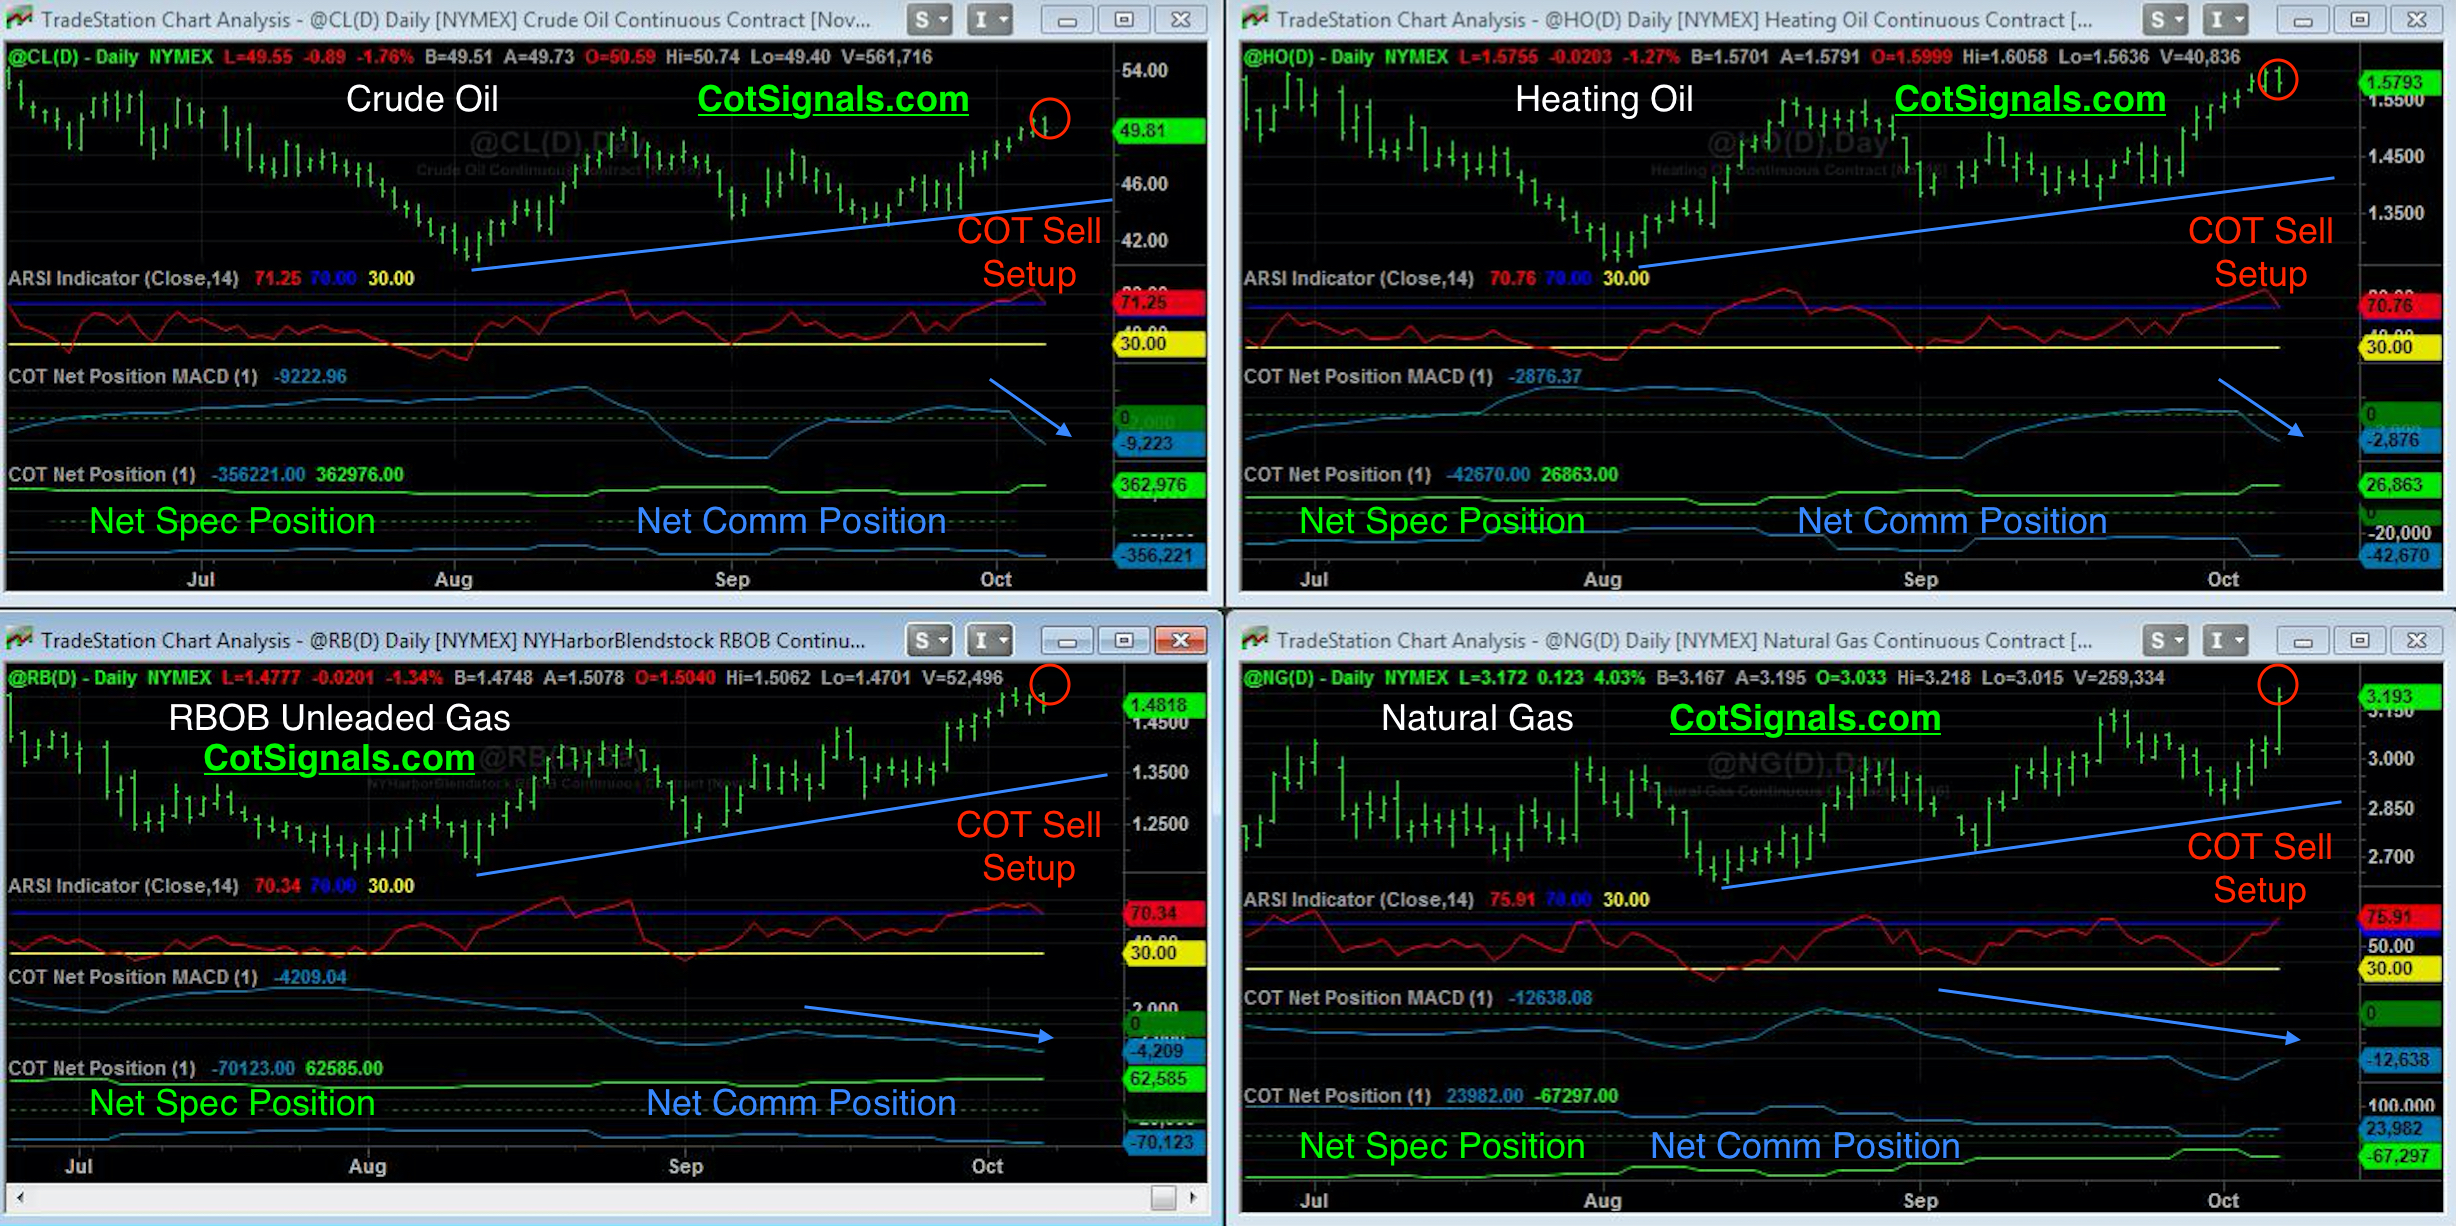
First, the energy markets appear to have bottomed. While our methodology openly called the August bottoms, it was simply a trade, and while there have been others since, the composite chart below is simply too small to show all of the trades. That being said, it’s the same strategy we’ll illustrate for the short-term trade as well as forecast into the future for the longer-term strategy.
The energy markets are very value dependent. The competition within the industry, especially as energy prices have declined has forced each operator to run as efficiently as possible. Actively hedging supply and demand forecasts within the energy futures markets is one tool both the producers and the processors use to meet their operating objectives. Their actions are a critical component in the success of their companies, and their actions within the futures markets are tracked by the Commodity Futures Trading Commission’s (CFTC) Commitment of Traders report (COT).
We use this report to track the actions of the hedgers versus the actions of the speculators. We then combine their net and total positions, which give us an idea of their overall capacity as well as the relative bullishness or, bearishness they have at a market’s current price. This data also allows us to separate speculative from hedging behavior to determine if the hedgers are running the market, as is normal or if there is a growing speculative bubble attempting to overrun the industrial capacity of a given market.
The energy industry had been starving for a rally as they’d recently sold production at a loss just to generate cash flow. This summer, the speculative shorts that trailed the market the whole way down got caught holding their most bearish position right at the August lows. Their short covering has given a considerable boost to the recent rally. Speculators were net buyers of more than 100k crude oil contracts in the month of August, and they’re on their way to a similar total for the month of October. A move above the June high near $54.50 should wipe out even the most ardent trend following speculators.
Hurricane Matthew is a big part of the last pop higher, especially in natural gas, and this is where we’ll start the trade setups. Natural gas has a strong seasonal tendency to rally this time of year because it is hurricane season and the natural gas complex of extraction, refining, and distribution is heavily centered on the Gulf Coast. That being said, natural gas may be the weakest of the energy markets, which could make this selling opportunity a choice trade. We want to sell natural gas and the rest of the energy complex for a short trade as we expect the damage to be minimal for natural gas and heating oil, moderate for crude and least damaging to RBOB unleaded gas. Commercial traders are and will be significant sellers of forward production at these levels in the near-term contracts.
Longer-term, as mentioned earlier, we think the energy markets have turned. We expect energy processors and exporters to step up to the buy side as these markets withdraw to test their recently built support. We’ll keep a keen eye on their behavior and update accordingly as the bigger move could be higher once the overbought speculative nature of the hurricane rally subsides.