Friday 23 April 2010
Happy birthday to William Shakespeare!
So far, there is no hard evidence of a market top, so the trend remains intact,
and the most important aspect for trading is knowledge of the trend. The first
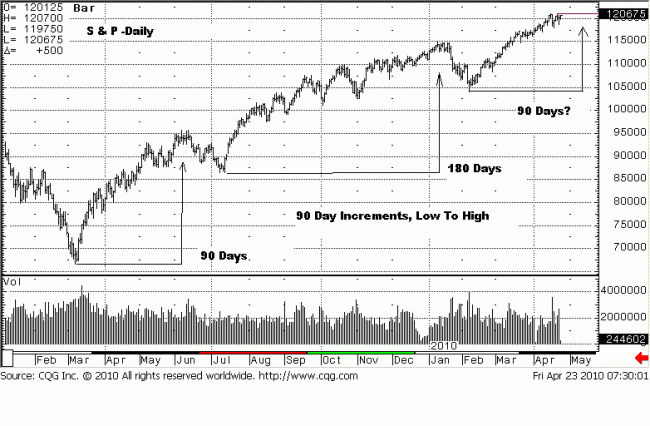
chart is a daily that shows how price is moving in increments of 90 days…a
quarter of the circle and an important time consideration.
From the 5 March 2009 low, price made a high about 90 days later, 5 June
2009. There was a short correction which bottomed around 8 July 2009, and
from that bottom, the next high was two 90 day cycles later, around 8 January.
That was followed by a correction to 5 February. 90 days from the last low would
project the current rally leg to potentially peak around 12 May 2010 time frame.
This is just a gauge, and market activity will determine any potential high as
opposed to an absolute date. There can be an orb of + or – a day(s).
Just an observation.

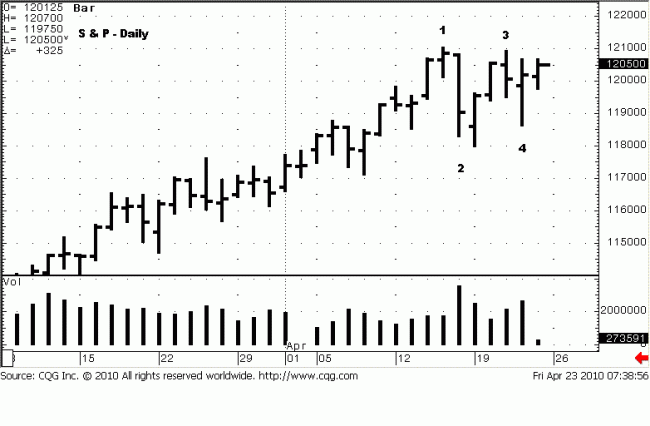
The second chart is also a daily, only the look is much closer, focusing on the
last several days’ trading. Number 1 indicates a narrow range bar high. This
can be stopping action, at least temporarily, but not necessarily trend changing.
The importance of a narrow range bar is that, in this case, it reflects the fact
that buyers could not extend the range higher, when buyers are in control. The
range did not extend higher because sellers were present, meeting and
overcoming the buying activity. A red flag.
Point number 2 shows the result. Supply selling entered the market. We are
calling it supply because the bar was wide range going down, and there was a
significant increase in volume, the largest since the February low. The question
then remains, to what degree will it impact the market? No one knows that
answer, so we have to wait and see how the market responds.
At point number 3, we get a retest high that closes under mid-range for the
day and lower than the previous day. This tells us that, at a minimum, we
should see a trading range develop. Point number 4 is a counter point to the
negative market information, and it serves to remind us that the trend is still
up, from a weekly and daily perspective, and we must always respect the trend.
Volume increased at the bottom of the decline, at the lows, and that was a sign
of a turnaround rally impending. We did not know the extent of the rally, but it
turned out to be fairly good. Once again, the trend effect.
Remember, in an up trend, demand is already proven. It is supply, [sellers],
that have the burden of proving an ability to change the tend, and changing a
trend most always takes time. The last bar on the chart is overnight activity
into pre-opening of the day session, as we write. It still shows a trading range
environment, and will remain so until the high is exceeded, and holds.

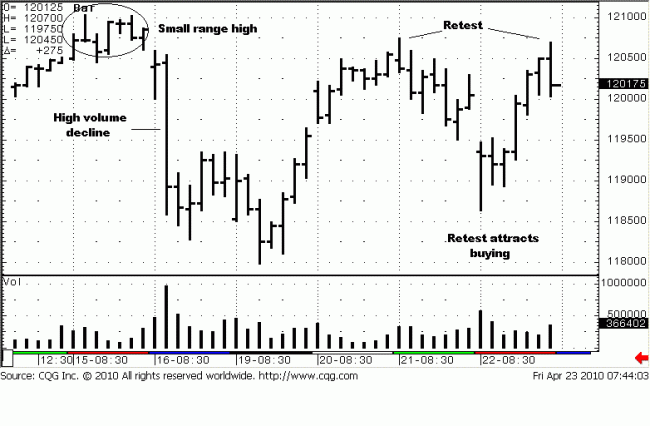
The 60 minute intra day chart gives a much closer look at market activity, The
ellipse in the upper left of the chart captures the narrow day trading range,
mentioned earlier. That led to a day session gap lower opening, last Friday,
which was then followed by the high volume spill price took. The high of the
high-volume bar becomes a potential resistance area, as sellers will defend it.
By Wednesday, we get a retest of the narrow range high, and the day session
opening bar probes higher, finds no more buying, then closes near the low of
the range, a red flag. We used this information for a short position at 1201.
Next day, yesterday, price gapped lower, and we covered half the position just
after the 7:30 a.m. [CST] news announcement, at 1194.50.
We saw obvious support in a range between 1180 – 1185, looking to cover the
balance at 1185. When the low occurred around 1186, we noted the large
volume increase on a 10 minute chart and a close on a bar about mid-range.
The combination of increased volume and the close just mentioned told us
there was buying, and we immediately covered remaining shorts at 1189.
One thing no one can ever know is how market activity will develop. From our
point of covering short positions, the market never really looked back and
launched into a strong rally by day’s end. It made us look prescient, but who
knew?!
As the market is developing in the present tense, early morning trade, the
trading range remains intact. We need to see strong price action that is
supported by strong volume to rally above previous 1211 highs. Not shown
or mentioned is the weekly chart, and as we enter into the last day of this
week’s trade, the weekly chart may close in new high ground.
There are no signs of a change in trend. Let the market tell us, through
observing price and volume activity, always the most reliable source of
information. News can be misleading, hard to interpret, and rarely a good
timing input, hence, we ignore it, totally.
The market never lies.


