From time to time- perhaps more often than we would like to admit- the ideas that we show in the IMRA are generated from ‘wonder if…’ musings. Today’s argument is based on the thought that the Canadian dollar simply will not or, at least, has not stopped pushing towards parity with the U.S. dollar. It reminded us of the way the Swiss franc kept grinding higher through the last few months of 2009. Given that the equity markets slipped into their most serious correction since the rally began last year about a month after the franc reached a peak… we wondered if there might be some way to compare the equity markets and Canadian dollar today with the equity markets and Swiss franc from the end of last year.
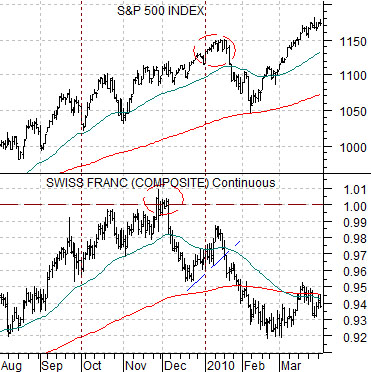
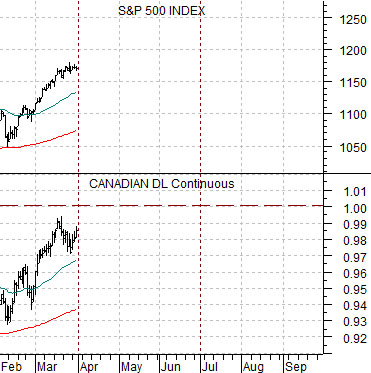
Below is a comparison between the S&P 500 Index (SPX) and the Swiss franc futures from August of 2009 through to the present day. Below right we feature the SPX along with the Canadian dollar (CAD) futures from February of this year forward.
We are attempting to ‘line up’ the Cdn currency with the Swiss franc based on two factors- quarters and time. The idea is that November and May are six months apart which puts them at opposite ends of the seasonal trend. Typically seasonal weakness into November should be bought while we are all familiar with the ‘sell in May and go away’ axiom. The point is that the markets tend to reach extremes- at least in a broad sense- in November and May.
So… after rising through .99 in October the Swiss franc made repeated attempts to cross above parity into November. At the end of the month- marking a bottom for the U.S. dollar- the currency finally crossed the 1.00 line, traded there for a few days, and then promptly turned lower. A month or so lower the equity markets began to buckle.
The argument is that the Cdn dollar has been trading extremely tightly with the SPX so as long as it is pushing higher the underlying trend for the equity markets should remain fairly positive. The first test will come if, as, or when the Cdn currency finally crosses back over parity with the greenback. If it reaches this level, holds for a number of days, and then breaks back to the down side some time during the second quarter then the idea would be that if history were to repeat exactly… we might have another month of stock market strength before we should seriously start to head towards the exits.
Equity/Bond Markets
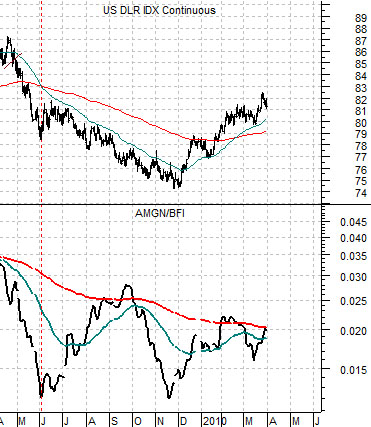
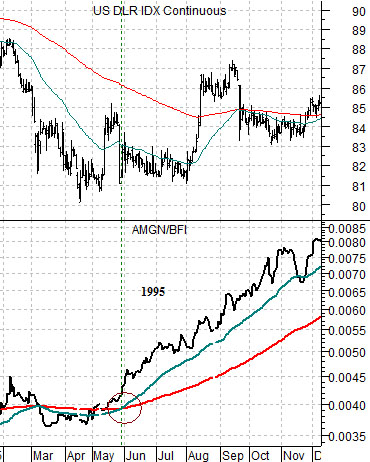
We can come at arguments from the strangest of perspectives. While it may seem hard to believe… we have included three charts of the U.S. Dollar Index (DXY) futures and the ratio between the share price of Amgen (AMGN) and the Baltic Dry Index (BFI) in an attempt to add on to the thesis presented on today’s first page. How we could leap from the Cdn dollar versus the Swiss franc over to a biotech/ocean freight ratio is difficult to explain.
A couple of years ago we introduced the idea that the dollar’s trend turns higher when the ratio between AMGN and the BFI turns higher so that the 50-day e.m.a. line crosses up through the 200-day. In order for this to happen there has to be either some amount of weakness in dry bulk ocean freight rates (representing commodity or Asian growth pressures) or strength in biotech.
The chart below is from 1995. It shows that when the moving average lines finally ‘crossed’ in late May the dollar was ready to turn higher. This marked the start of a dollar ‘bull’ that would run right through into the end of 2001.
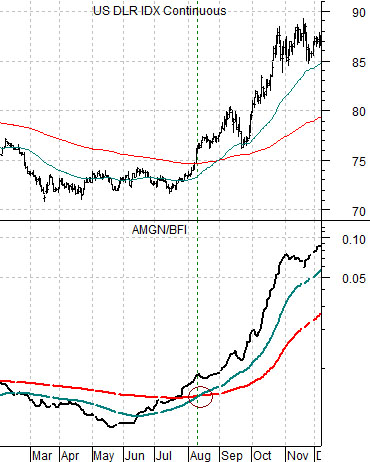
Further below we show the same comparison from 2008.
Last chart below is from the current time period. Notice that while the ratio has pushed higher repeatedly since mid-2009 it has weakened before the moving average lines were able to ‘cross’. This suggests that to the primary trend has been euro weakness rather than dollar strength (hence the continuing upward grind by the commodity currencies).
In the past AMGN has shown a tendency to rise from May into August. Our thought is that this could lead to a stronger dollar trend some time around June which fits in the idea that the Cdn dollar may reach parity in May and then turn back to the down side in June.