The stock market jumps up one day only to give it all back the next. But this back and forth price action will only persist until it moves too far, either up or down, and then it will surge and become persistent. So where are the levels marking how far is ‘too far’?
Click here to watch a video explaining how to read markets using volume at price.
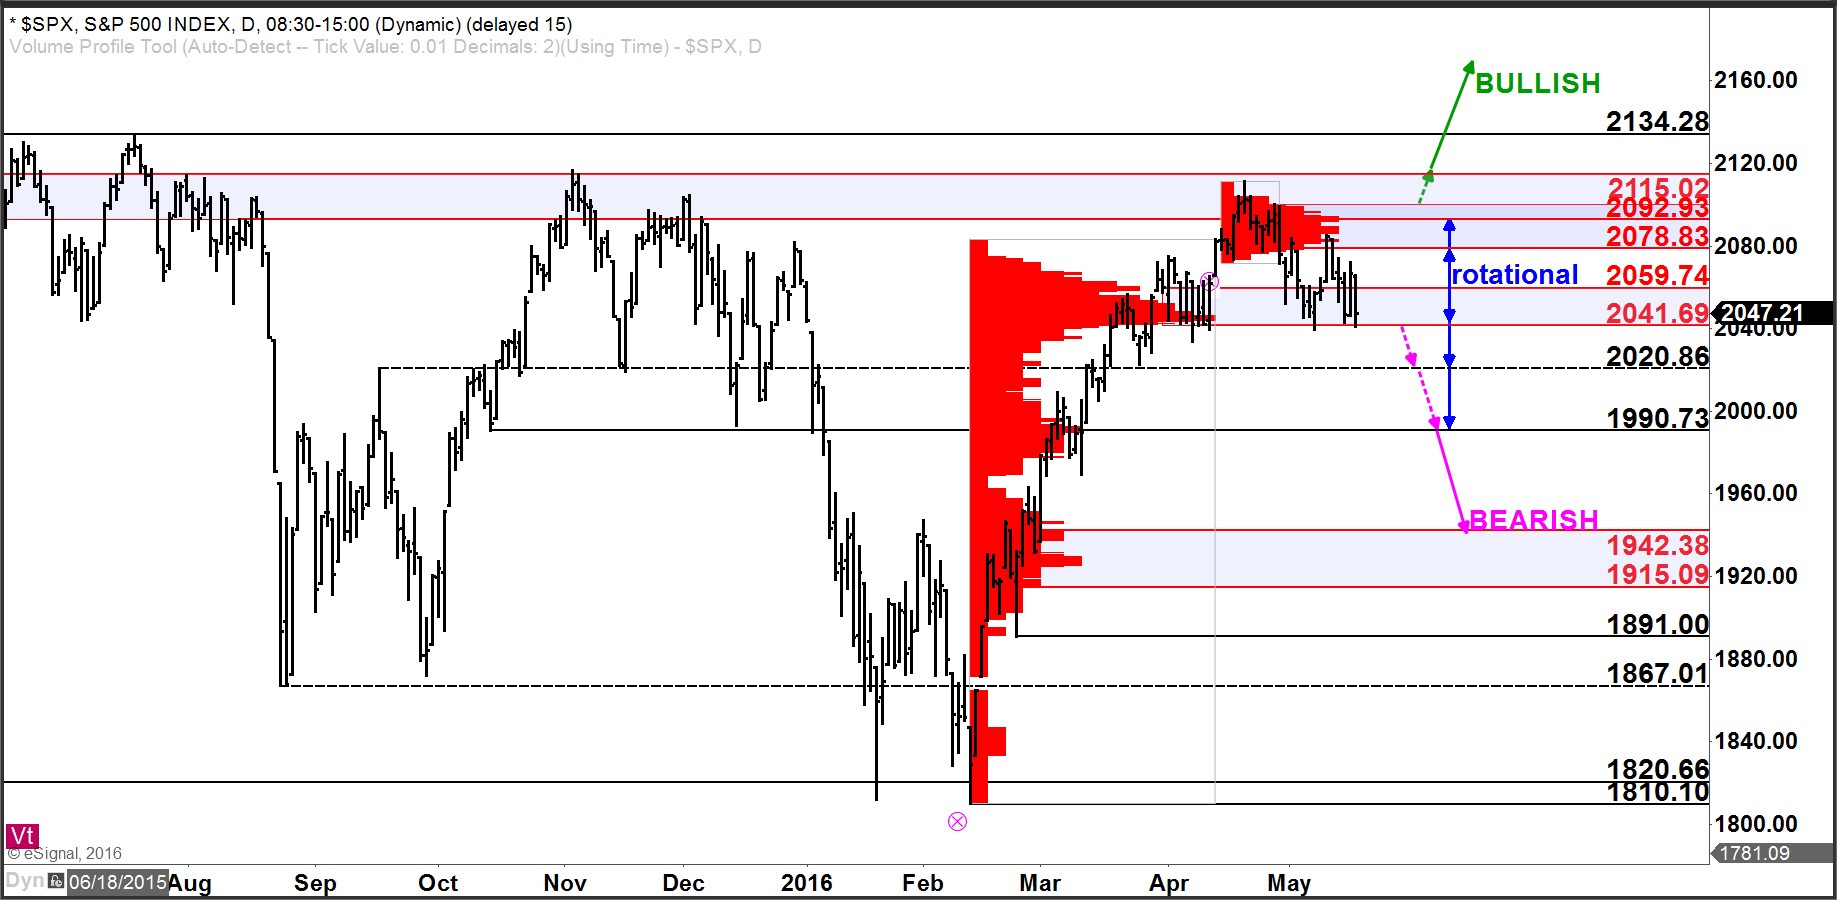
The S&P 500 index ($SPX) began the week rallying sharply from a test to key support at 2041. The following session, the index reversed and declined all the way back to this important support level.
Any breach of this 2041 support level would be a near-term bearish development and target a further decline to 2020 and 1990.
To the upside, there remains higher resistance at 2078 – 2093. A move above 2093 is needed to signal a shift to favor the bulls.
While between 2041 and 2093, the bias remains for rotational, two-sided price action.