Wednesday 10 March 2010
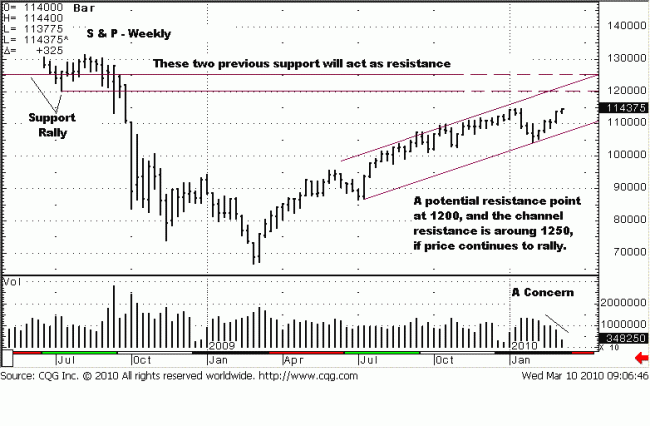
This weekly chart shows an up channel that captures the market activity, to
date. Back in July 2008, there was a reaction low at the 1200 area, noted by
“Support Rally” on chart, extended into the future. This past support will/may
act as resistance into the future, the broken portion of that horizontal line.
There is a second reaction low, from March 2008, that does not show, but it is
the higher horizontal line, drawn for the same reason. The initial 1200 level
would be the first potential resistance, using past market activity as a guide.
The channel line extends into the future, as well. the top line would indicate
an overbought condition, the bottom line oversold, and support. The top
horizontal line from march 2008, and the upper channel line converge around
the 1250 area, another potential resistance, should price continue to rally.
The one concern is the drop-off in volume. Demand is not that great, and a
lack of demand is hard to sustain a rally. However, demand was not that great
during the “POMO” rally last summer. Price is always the final arbiter, but these ancillary indicators will ultimately have a bearing on price. For now, the S&P
looks higher with no ending action.


