
By: Fernando Gonzalez, EvolutionTrading.net
March 6, 2010
Enough time has gone by since we have discussed the Precious Metals markets in detail. We left off at or near its peak in late 2009, expecting major pullback, which arrived. Gold retraced $181/oz or 15% from its peak in November to its current swing LO in Feb 2010. It has currently recovered about half that damage, and been relatively quiet. Things are somewhat different elsewhere in the world of Precious Metals, let’s take a look:
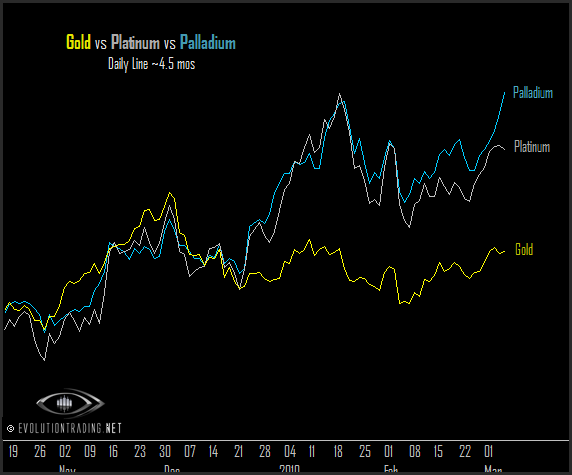
In the chart above, we overlay Gold, Platinum and Palladium, and use the December 2009 swing LO as an anchor point to study relative strengths and weaknesses. It is quite clear here that Platinum and Palladium have since developed a very high degree of relative strength in comparison to Gold. What’s going on? Let’s pan back to take a look at the bigger picture:
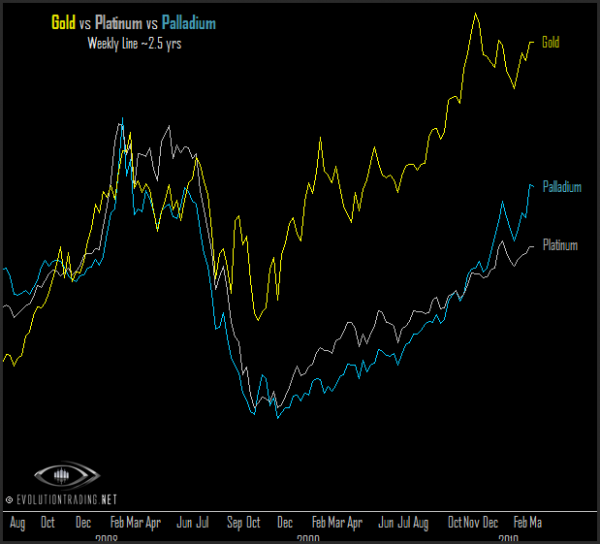
In the chart above, we are seeing approximately 2.5 years of price action on Gold, Platinum and Palladium. The anchor on our overlay is the 2008 HI. Although the declines in all 3 markets were large in 2008, Platinum and Palladium’s declines were massive: in a very short period of time, each of those markets lost approximately 70% of value, until they bottomed in October of 2008. In comparison, Gold lost “only” 35% – about half the damage of the other two. If these markets tend to trade together, what happened at that time? 2008 will forever be remember as one of the most vicious years in the financial markets. Financial Institutions collapsing left and right. Gold and Precious Metals bugs were left scratching their heads: If financial armaggedon is here, then why are our precious metals collapsing in value as well? Weren’t these sold as “the hedge” against financial demise? As bizarre as reality would have it, Platinum and Palladium allegedly collapsed due to the anticipation of a collapse in their demand as their main use in the auto industry (catalytic converters) would fall along with the apparent permanent disappearance of demand for cars. Platinum and Palladium went into an old fashioned nosedive, losing roughly 70% of their respective values. As quickly as it started, these markets, Gold included, bottomed in October of 2008, and have since recovered in a huge way. You will see on the chart above, that Gold naturally went to new all-time Hi’s first, just a year later (being the market that previously decline the LEAST).
On our first chart this week, however, we observe that Platinum and Palladium are carrying a great degree of relative strength in comparison to Gold. The current strength in these two markets are reflexive: getting back “in sync” with the leading market, which is Gold. Reflex, or mean reversion, occurs and is most obvious in highly correlated markets. A good example is what happened between Gold and Silver, let’s take a look:
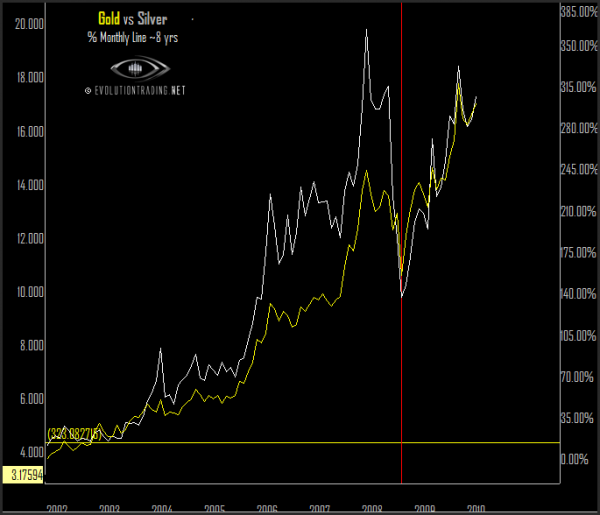
Our chart above overlays Gold and Silver over an 8 year period, where we anchor the overlay and begin with a 0% return. The red horizontal line labels the major LO in October 2008 (also where Platinum and Palladium bottomed). Prior to the red line, notice the % return on Silver was much higher than that of Gold. The events of 2008, truly a pivotal year in global financial markets, brought these 2 correlated markets back together, where they lie today, both approximately 300% higher than 2002. This is an example of reflex, a reversion to mean of sorts, that demonstrate high correlation. While Gold, Silver, Platinum and Palladium are used for differing industrial purposes, one cannot ignore that they are also owned privately for the very same reasons: investment. This year’s unique strength in Platinum and Palladium appear as a reversion to their long-term correlation to Gold and Silver as monetary units. Some will account for their strength due to a resurgence in the demand for automobile related technologies, and this may be true. Nevertheless, prices appear to be reverting, as Platinum and Palladium catch up to Gold and Silver once again.
Some quick technical notes on Platinum and Palladium (more “Alchemy”):
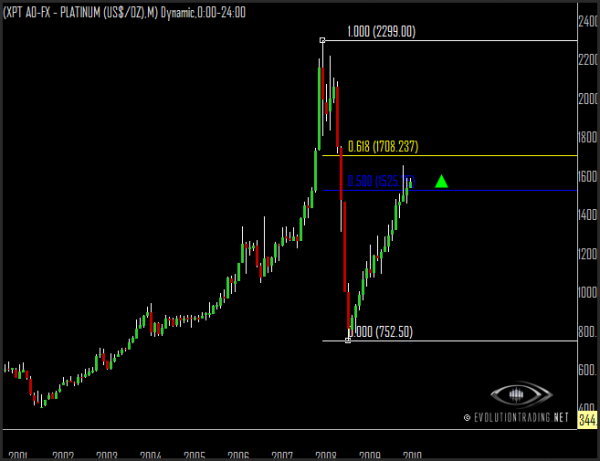
The recovery in Platinum is impressive, as it has been a solid climb to retrace more than half the damage of 2008. It is not likely that we have seen the last of that collapse, the probability of another downward impulsion here is good. Movement to new Low, however is far-fetched for the time being, especially that Gold is still very much in a Bull Market state. Trading above the simple, but important 50% retracement (blue) puts a move towards the 62% retracement into play here. Short-term momentum and relative strength calls for continued upward progress, so long as Platinum is trading above its 50% retracement point.
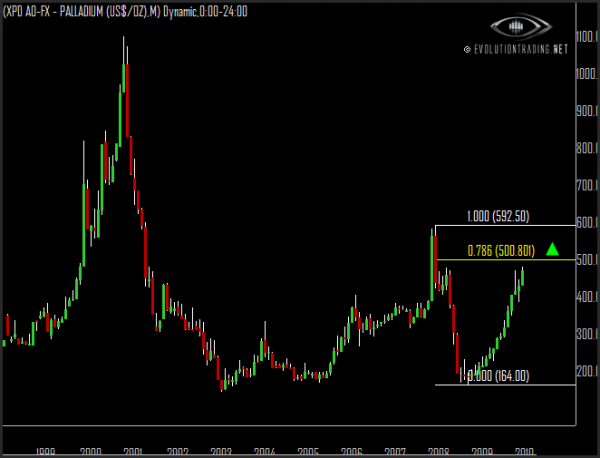
Palladium’s Monthly chart is very complex in comparison to Gold, Silver and Platinum. It is quite a volatile and highly speculative market. At this point, the $500 level plays an important role, technically and psychologically. It is likely to serve as formidable resistance and while it is still trading underneath, a movement to that higher level is likely to coincide with a breakout on Gold as well. With Gold being still in Bull Market state, sustained trading above $500 in Palladium is likely to launch it to new Multi-Year Highs. An upside breach of the .78 Fib retracement (yellow) is always accompanied by high-probability move to new Hi.

