We are still trying to reconcile a number of views that, at least on the surface, appear to be somewhat contradictory. The ‘decade trend’, for example, suggests that we will see a peak for one or more asset classes later this year followed by a correction through into late 2012. When we view relationships based on swings in the yield curve the conclusion is that the major banks should be in a positive trend into 2012.
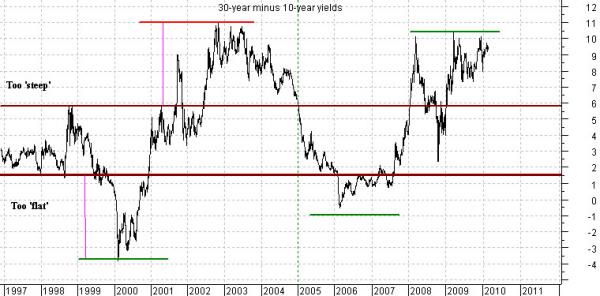
We have done the ‘decade trend’ on quite a few occasions and are quite certain that we will show it in the months to come on many more occasions so we thought we would focus on the yield curve today. The chart below features the yield spread or difference between 30-year and 10-year U.S. Treasuries from 1997 through to the current time period.
The first question that we struggle with is… whether the markets react with a 3-year lag or whether the series of extremes set 3 years apart is mere coincidence. We could argue it either way but the basic point would be that in the here and now it really doesn’t matter since the end result is pretty much the same.
When the yield spread declines to the point where it is ‘too flat’ it acts as a brake on economic growth. The spread became ‘too flat’ into 2000 and the stock market bottomed 3 years later around the start of 2003.
The spread became ‘too steep’ into 2003 and the cyclical trend topped out 3 years later in the spring of 2006. From there the yield spread declined until it was ‘too flat’ into 2006 and once again the stock market bottomed 3 years later in early 2009.
In a sense the chart suggests that the Fed and/or the markets are ‘over steering’ like crazed drivers on icy roads. The economy gets too strong and the yield curve flattens out which leads to slower growth which is met with a rapidly steepening curve. Rinse and repeat in 3 year intervals.
If the cyclical trend includes the major financials then the peak for the yield spread into 2009 argues for some kind of top in 2012.
The only way that we can imagine (at this time) a major asset price decline in the face of a cyclical recovery based on a ‘too steep’ yield curve is if the assets under pressure are (1) gold, (2) bonds- especially Japanese bonds, and (3) non-dollar currencies.
The ‘decade trend’ argues that assets or markets that ramp upwards from the 7’ year into the ‘0’ year tends to shift into bear markets through the ‘2’ year. To understand the final point that we made on page 1 we have included two comparisons on page 4. One compares the Nasdaq from 1997 into 2000 with gold futures from 2007 to the present day while the other shows platinum futures from 1977 into 2000 with the combination of the U.S. 30-year T-Bond futures times the Japanese yen.
We have argued that there are two factors pushing gold prices higher- the weak dollar and the weak bank share prices. What would have to happen to turn gold prices lower? A strong dollar and strength in bank share prices.
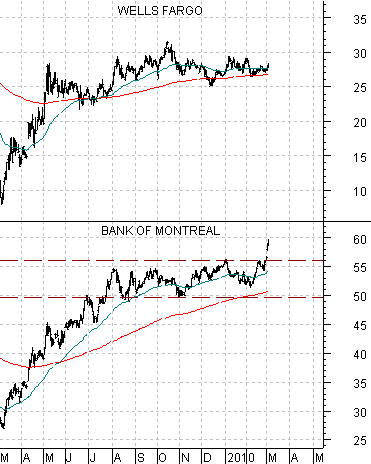
Below we compare Wells Fargo (WFC) with Canada’s Bank of Montreal (BMO on Toronto and New York). We pointed out yesterday that the Canadian banks had broken out of six-month trading ranges this week. If the trend holds then in due course the U.S. banks will swing upwards and if the wind blows so hard that even pigs can fly then the Japanese banks will shift upwards as well.
Below is a chart comparison between Wal Mart (WMT) and the ratio between stocks (S&P 500 Index) and bonds (TBond futures).
The argument is that as long as large cap stocks like Coke and Wal Mart are still working off the bubble-like valuations of the end of the 1990’s the ratio of equities to bonds is going to be range bound. Notice that each test of the channel extremes has gone with a major trend change. In 1997 Asian and commodity prices turned lower. In 2000 the stock market peaked. In 2002/3 the stock market bottomed. In 2007 cyclical growth (i.e. real estate prices and the banking sector) peaked while in 2009 the equity markets bottomed. The points are, we suppose, that we are currently mid-trend to some extent and unless WMT is nicely through 70 the next time the SPX/TBond ratio rises above 13:1 we should probably remember to head for the exits.