By: Arkady Gevorkyan
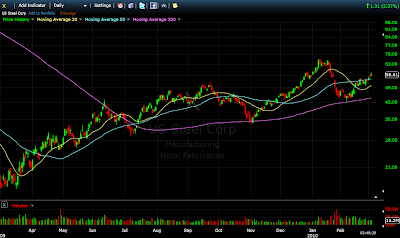
In my last blog post on February 6th, 2010, I mentioned the charts of FCX, X, and NUE. This analysis will focus on X and FCX. These stocks held their support levels very nicely and reversed higher. My call was to play those stocks long, against the support levels (200 day MA). I am primarily an intraday trader but this gave me a directional idea of how to trade the stocks during the day since I always base my trading on the daily charts, too.
Now, obviously, FCX bounced very nicely off the 200-day MA support level, and is now flagging to trade in the higher prices. Yesterday, it broke another important level at $77.88. In my opinion trading in this stock will get much sloppier and it will be more back and forth action (which will offer a lot of short and long short-term setups). However, I will still use the 200 day MA as my support level, and until it breaks it, I will keep a macro long mentality. I think there’s a good chance it makes new 52-week highs by the end of the year.
According to the chart, X has been a stronger stock over the last several week than FCX. Since it broke its 50 day MA and has since held higher above the level at $54.13 which was set few days back. Now, I think it could be a little bit extended here and trading, as in FCX, will be sloppier with some long and short setups. The stock will likely get into higher prices, but it may be a little bit harder to trade the intraday price action.


