For several months, we have encouraged readers to consider buying dips in gold and silver issues. The February rally in metals has rewarded those who took long positions, and it also has revealed an important clue about where prices may be headed during the next several years.
Within the Elliott wave framework, the strong February rally has made it very unlikely that gold can put in another lower low. This has forced us to reconsider the count, and the conclusion is a very bullish one.
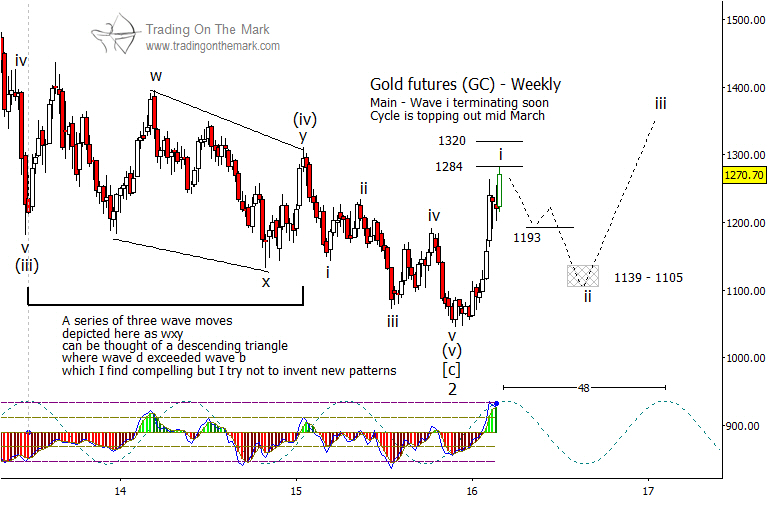
The chart below shows the implications of treating the net sideways move from mid-2013 to early 2015 as a complex corrective fourth wave, and then treating the overlapping decline we saw during 2015 as an ending diagonal fifth wave. Each segment of the pattern counts out well, meaning that gold probably finished its decline at the low of late 2015. The strong rally since that time probably represents the start of a very large upward wave ‘3’, which should take price above the all-time high seen in 2011.
To get a sense of the scale of the expected moves, consider that an upward wave ‘3’ should consist of five sub-waves, which we would label as [i]-[ii]-[iii]-[iv]-[v]. Within upward sub-wave [i], we would expect to see five smaller sub-waves, designated as (i)-(ii)-(iii)-(iv)-(v). Zooming in even closer, upward sub-wave (i) should consist of five sub-waves, ‘i’ – ‘ii’ – ‘iii’ – ‘iv’ – ‘v’. The rally we saw in February probably represented wave ‘i’ on the smallest of the three scales.
Going forward, watch for opportunities to buy at retracements, such as the projected wave ‘ii’ retracement target zone near $1,105 to $1,139. We will update targets as more price data roll in.
Our newsletter this month discusses the big picture in interest rates and treasuries. Click here to request your copy!


