Let’s talk about gold for a minute. And the G20 meeting last week. And the Fed’s flirtation with a Negative Interest Rate Policy. And the US dollar, now faltering a little. And what the stock market will do as a result. All in 450 words.
It is getting hard to discuss anything in the market without discussing everything. We are short-term people, interested mainly in what the S&P500, the large-cap index of US stocks, is likely to do in the next few days or the next few weeks.
But even for us, with our deliberately narrow focus and our reliance on tools that seek to explain the market by its actions and not its causes, even for us it is becoming difficult not to get drawn into arcane discussions of the effect of the USG/JPY carry trade on the SPX.
Everything is connected to everything else. A butterfly flapping its wings in Brazil can be a symptom of dramatic changes in weather patterns that will ruin a gold production facility in Indonesia and send the price of bullion bounding higher, which will precipitate a crisis in the financial institutions that are short; which will induce the Fed to start a new Quantitative Easing policy, which will send the S&P raging higher; which will send the price of Gold into the tank; which will induce Brazilian campesinos to switch from panning gold to cutting logs; which will ruin the forests; which will kill the butterfly.
Or not.
The point is that the whole business is too complicated to be understood, by anybody, and all the analysis of the causes of economic events is either fallacious or useless. Even when it works, by the time we figure everything out, it is too late to be useful.
Which is why we stick with technical analysis as our main tool for understanding the market. It is simpler, predictive instead of descriptive, and fast enough to give us guidance while it is still useful.
So with that in mind, here’s our outlook for the S&P this week.
Last week
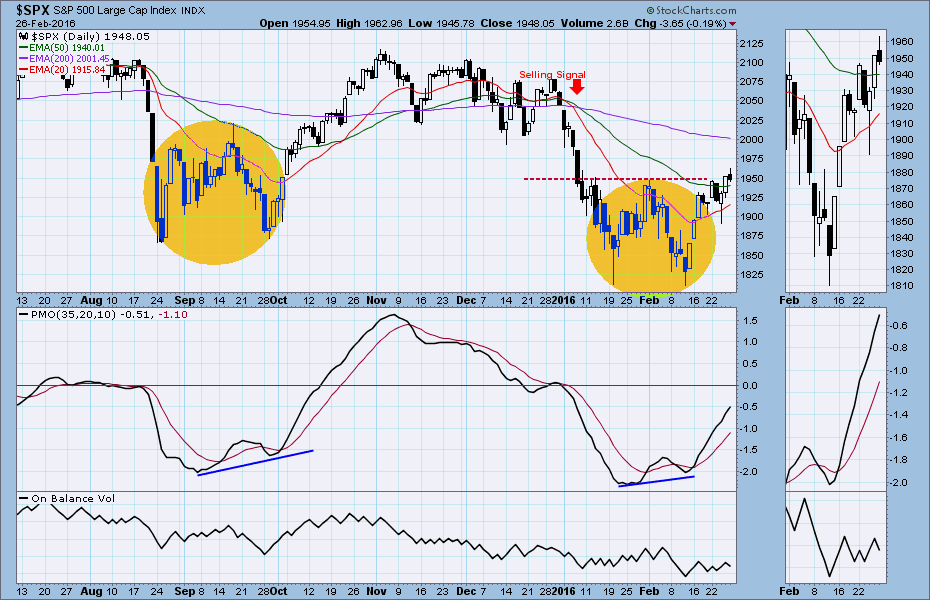
The large-cap index (SPX) closed at 1948.05 on Friday, up 30.27 points for the week, a net gain of 1.57%. A nice little bounce, but we still see this as a retracement in a topping market, although the short-term trend is positive … except for that nasty retracement on Friday, which looks like a reversal of the short-term rally.
The SPX has now broken below the four-year uptrend line, but remains above the seven-year uptrend. We are still above the 200-week moving average, but below the 50-week line. And we have bounced from and remain above an important support area.
The market is dangling over the precipice, but it has a couple of handholds.
This week
Monday will be an important day. The end of the month, the expiration for monthly options, the beginning of the last month in this quarter. The closing price today will provide some important clues about where we go from here for the short term. It could be in either direction.
The key line 1950 will be an important price point for Monday’s close. Closing below it will convince us that the major short-term downtrend is still intact. For the rest of the week the direction will likely reflect Monday’s close, either up to retest last week’s high or continue below Monday’s low for the rest of the week.
There are relatively few economic reports being released this week, and far fewer appearances by Fed officials.
Today
We use the S&P500 mini-futures (ES) for our short-term trading. The ES had a gap up at the open Friday, but buying strength quickly disappeared; instead profit taking sent the price back down below the 1950 level, and it closed slightly above the neckline of the double bottom. We have a slew of index options expiring this week, and that might be affecting the price action.
Short-term indicators are overbought. This, in conjunction with the candle reversal on Friday could lead to a further decline in the early sessions today.
A move below 1945 may push the ES down towards 1930-28.50 or lower near the 1923.50-21.50 zone (long area).
Conversely a break above 1953.75 could push the price above 1957-60.50 or higher up to 1966.50-69.50 to retest yesterday’s high (short entry)
Major support levels: 1923.50-21, 1907.50-03.75, 1893-92, 1881-75, 1833-31
Major resistance levels: 1950-56, 1964.75-69, 1975.50-79, 1990.50-93.75
Visit www.naturus.com to see Naturus.com’s full outlook for the week ahead, free of charge.
Chart: SPX Daily chart to Feb. 26. 2016