
By: Fernando Gonzalez, EvolutionTrading.net
February 20, 2010
Although 2010 has brought in a good dose of volume, action and volatility which traders love, the last several trading days have yielded enough evidence that the market has returned back to a behavior we can only describe as lethargic, lifeless and miserably undecided. Quite disappointing, and I’m probably not the only one who would say “I hate it when it does that.”
As market participants, we engage the markets to take capitalize on its volumes or volatility, but there are also those times where the market’s reminder of “the rules” is quite clear: that our skills as are not just measured by how well we engage the markets, but also, how good we are recognizing when to back off. It would be a great disservice to the readers of this newsletter to declare that much is going on with the markets, when there really is not. Let’s take a look:
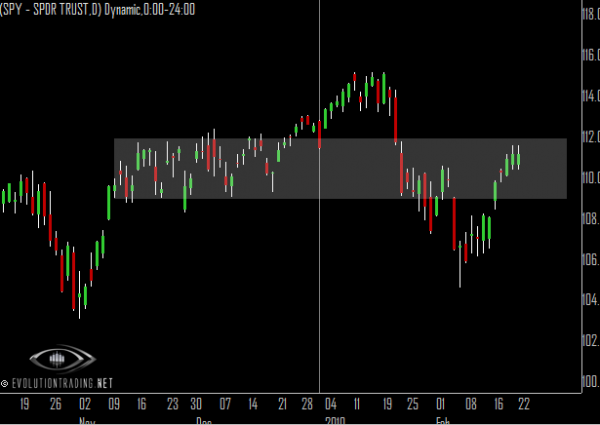
The Daily chart of the S&P500 above, via SPY goes back October of last year. The vertical line around the middle divides 2009 and 2010. The arrival of volatility a couple of weeks after the turn of the year is quite clear here as markets retrace about 8% of the value of the S&P in a fast way – this was exciting, in comparison to the miserable practically comatose state that preceded it. Since the market bottomed on Feb5, it has repaired the damage quite well, although in a manner that was less than exciting. The market’s return to the area where it spent several weeks wandering aimlessly late last year (shaded area) prompts us to hope we don’t get more of that (again!). These past few days have certainly reminded us how miserable the trading was late last year, as the ranges were tight, and on many occasions, we found the S&P trapped in a mind-boggling 2 point range for hours on end. When ranges are tight like that, all short-term participants are left to fight for miniscule profits within a very tight space… that’s my idea of wall street “bloodbath,” quite the opposite of what a common investor might define it as. Nevertheless, we have few technicals to work with:
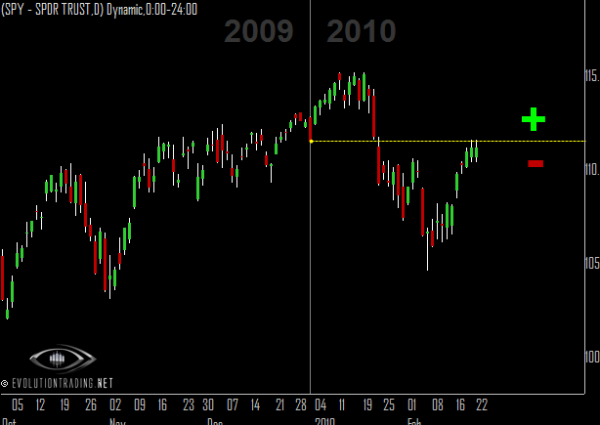
The SPY chart above is the same as the one that preceded it, except that we label an important pivot zone that marks the close of 2009, now key Resistance. It delineates the + to – territory for this year, which is quite important to measure who is really in charge in the early going this year. More time has been spent in negative territory, and the largest impulsion (most violent move) is still downwards. At this point, it is clear to me that the Bear dominates 2010. Movement back into the positive state, however, puts into play a move to new YTD High – it would be wise for the Bear participant to back off if the S&P were to move back into positive territory for the year. Not only do we have these technicals which are in play over the short-term, but it is important to note the Long-Term as well, let’s take a look:
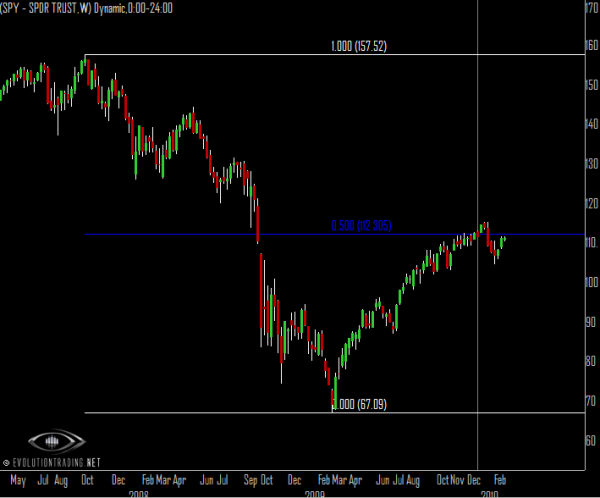
The Weekly chart of the S&P500 above marks and extremely important “middle line” (blue) that divides the big decline from the all-time Hi, the always-key 50% retracement. We noted in the previous newsletter that the recent decline is no more than a simple “reaction” to this key level that probably should not be the cause of too much excitement until we see follow-up impulsions. There has been none, and as noted on the prior charts, we are in fact worried that the market might return to the extremely lethargic state it was in prior to the decline. Nevertheless, movement back above our key marks here, in both long and short-term notations, puts an attempt by the markets to move to new highs for the year into play. Stay tuned.

