

In our post last week, our chart showed gold futures as being in the process of making a wave ‘4’ low this year. There are other ways to interpret the count, and the chart for silver futures included below shows one such alternative for precious metals generally. In all the scenarios, the theme for the next one to two years should be “buy the dips,” but the specific triggers and target/resistance levels may be different.
The entire decline in precious metals from 2011 can be viewed as a completed wave ‘4’, but it also might be seen as merely the first sub-wave ‘A’ of a large, sideways wave ‘2’ correction. We have a slight preference for the latter scenario, which is reflected on the chart for silver futures, below.
Regardless of which scenario turns out to be correct, the better long-term trades during the next two years should be upward. On the chart for silver, we have drawn some resistance targets based on Gann techniques, which could mark areas for inflections as price moves generally higher in wave ‘B’ of ‘2’. For example, the Gann resistance near 19.80 indicates a possible area for sub-wave [a] of ‘B’ of ‘2’ to complete. The higher resistance levels near 23.60 and 27.30 indicate likely areas for the entirety of wave ‘B’ of ‘2’ to finish.
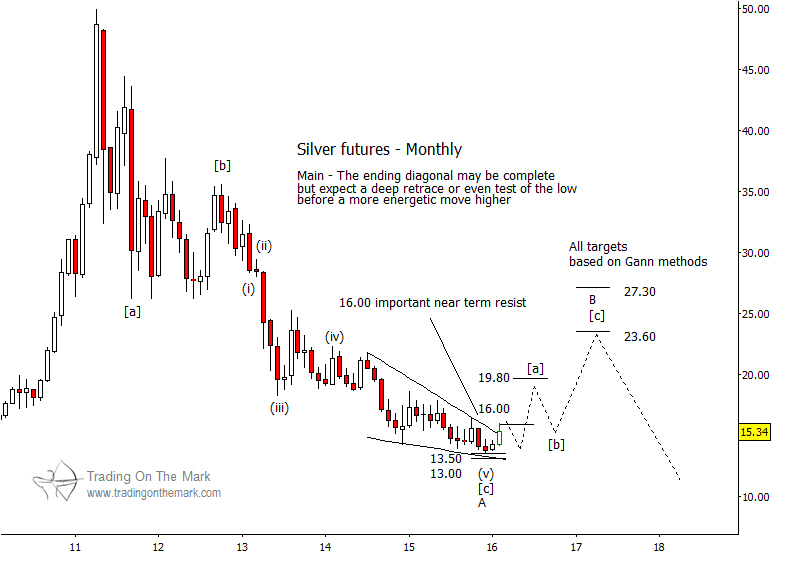
In the near term, the most important question for traders is whether the decline is finished. Based on the energetic bounce by precious metals out of support areas during the last week, we believe there is a high probability that the downward-sloping diagonal pattern marked on the chart has completed. If we see price break above approximately 16.00 in silver futures, we would regard that as better confirmation that the downward pattern is complete, and that price is now moving upward in one of the formations we have described as possibilities.

