
This is not too encouraging:
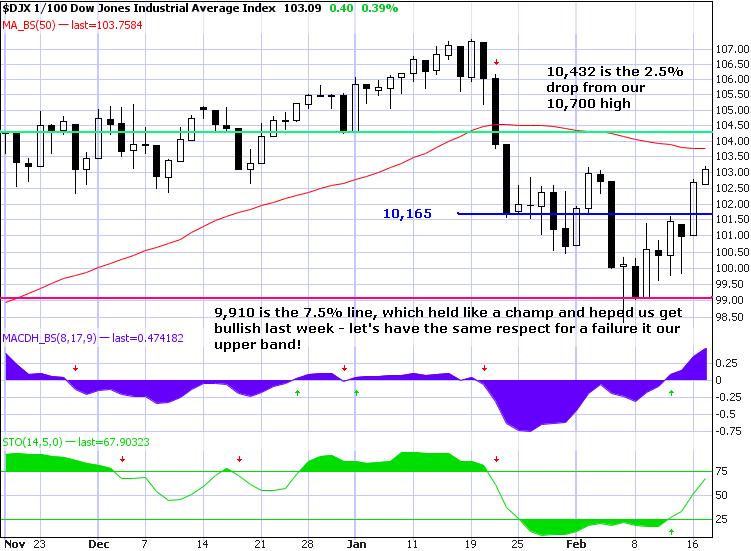
If we can’t break over our falling 50 Dma then it’s very likely we’re forming a lower channel that will center around our 5% line at 10,165 but we need to keep in mind that the 200 dma is WAY down at 9,552 and doesn’t even make the 3 months chart so we have to seriously consider that our 10% line at 9,650 may still be in play if the markets can’t show us the money by next week (this week is options expiration so it’s hard to believe anything we’re seeing here).
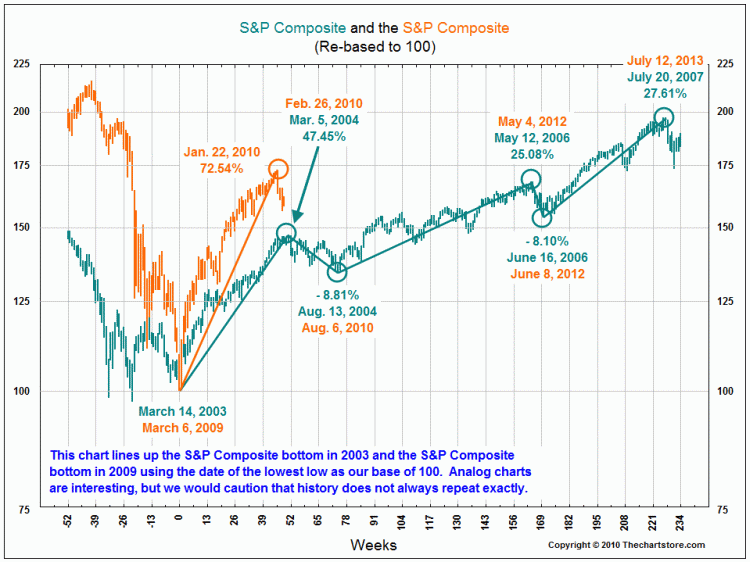
I have been contending that we are following a similar chart pattern to the one we had in 2004 this year and Barry Ritholtz had found a good comparison chart for us and so far so good as we expect a healthy downward consolidation as we work though our remaining issues this quarter (I’m hoping we turn around after May earnings):
Keep in mind that 10,300 on the Dow is NOT a breakout, 10,300 is the EXPECTED bounce off the 5% rule at 10,165. NOT getting a 1% bounce off a 5% drop (as we didn’t in early Feb) is a negative sign that indicates an expected further leg down. This will mark our 2nd test at this level and we see how the last one went on day’s 2 & 3 so let’s keep a close eye on today’s movement and, of course, without confirmation of our bounce levels from the S&P (1,105), Nasdaq (2,225), NYSE (7,100) AND the Russell (625) – we’re certainly not going to get excited about anything the Dow does.
We have lots of fun data today with the PPI and Jobless Claims ahead of the bell and, at 10am, we get Leading Economic Indicators and the Philly Fed (which has been AWFUL lately) followed by Natural Gas Inventories at 10:30 and Petroleum Inventories at 11. After the bell we’ll see the Fed’s Balance Sheet and the Money Supply and Fed Govs Lockhart & Bullard will give their outlooks on the US Economy.
IN PROGRESS

