We focused rather intently in yesterday’s issue on the intermarket ramifications of strength and weakness in the ratio between copper prices and the CRB Index. The argument in short was that a very strong ratio goes with Asian economic strength and rising interest rates, a very weak ratio goes with broad cyclical weakness and falling interest rates, while a ‘flat’ ratio close to the highs and generally above the moving average lines can lead to a powerful upwards swing the semiconductor stocks.
Before leaving this topic and moving on we wanted to take one last kick at the can.
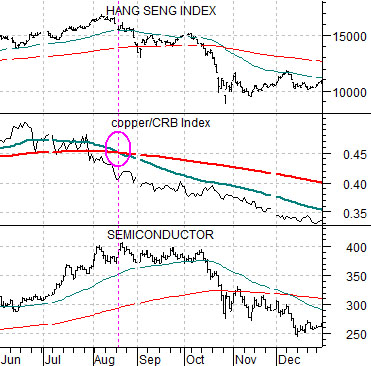
Immediatly below we show a chart from 1997 which compares Hong Kong’s Hang Seng Index with the copper/CRB Index ratio and the Philadelphia Semiconductor Index (SOX).
In August of 1997 the 50-day exponential moving average line for the copper/CRB Index ratio ‘crossed’ down through the 200-day e.m.a. line. This marked the highs for the Hong Kong stock market and the semiconductor index. With the copper/CRB Index ratio leading the way to the downside- arguing that cyclical growth was slowing rapidly- the Hang Seng Index worked through a ‘top’ before collapsing in October.
The point is that worrying about China and Asian growth is all the rage these days but from an intermarket perspective the key is whether or not copper prices weaken sufficiently relative to the CRB Index to pull the ratio well below the 200-day moving average line.
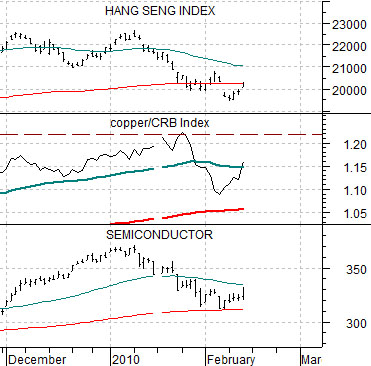
Next we show the current situation. Notice that the markets sold ‘cyclical’ sectors to start off the year with the SOX and the Hang Seng Index declining by somewhere close to 15%.
The copper/CRB Index ratio declined late in January but as of today it remains far enough above the moving average lines to create the impression that concerns with respect to the tightening of credit in China are more fluff than happenstance. In other words… it is not the first monetary tightening that one has to worry about but rather the last. The Fed raised the funds rate for a full 3 years between 2004 and 2007 before the markets began to implode in earnest. The argument would be that with the CRB Index currently close to 270 it would take copper prices well below 2.70 (i.e. a ratio under 1.00) before our bullish convictions will seriously be tested.
Equity/Bond Markets
For many years we focused rather intensely on the share price of Phelps Dodge in our work. We used PD as a surrogate for the equity market’s response to the underlying commodity trend. Now that PD is gone we tend to use FreePort McMoRan although that really isn’t our point today. Our point is that we use individual stocks to represent broader themes and one of the stocks that we have been particularly fascinated with is Japan’s Mitsubishi UFJ (MTU).
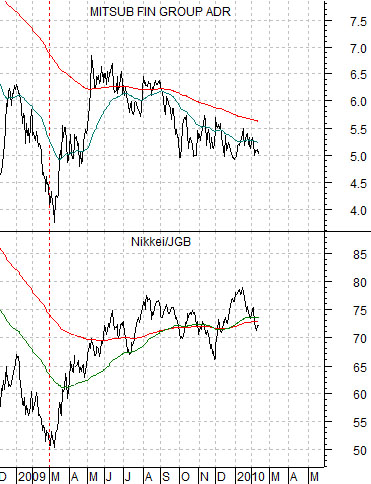
Below is a comparison between MTU and the ratio between Japan’s Nikkei 225 Index and Japan’s 10-year (JGB) bond futures.
From as far back as 1994 but most certainly since 1998 the Japanese (and U.S.) equity markets has tended to rise when bond prices are falling. In other words a positive trend will include rising stock prices and falling bond prices which, of course, creates an upward tilt for a ratio based on equity prices divided by bond prices.
The share price of MTU trends very closely with the ratio between Japanese stocks and bonds. We can argue, for example, that the relative strength through 2009 in the Japanese bond market is a reasonable explanation for why Japan’s banking shares have been so much weaker than similar U.S. names over the past year.
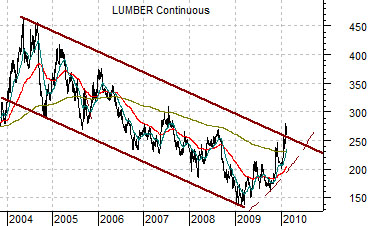
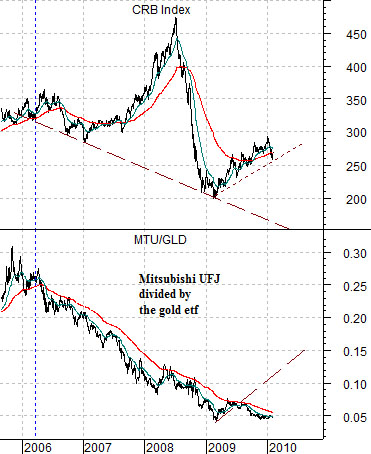
In any event… one of our arguments has been that the subprime crisis was the end result of a sequence of events that began in 2004 when the Fed started to raise the funds rate. One of the first markets to turn lower was lumber futures (more on page 3) followed in late 2005 by the share prices of the home builders along with the ratio between MTU and gold prices. The chart below right argues that the collapse of the commodity markets in 2008 was basically a lagged response to the relentless decline in the MTU/GLD ratio (banks versus gold) that started around the beginning of 2006.
The point? If lumber prices declining in 2004 preceded a down turn in the MTU/GLD ratio in 2006 that eventually led into the subprime crisis and commodity markets collapse in 2008 then what the markets ‘saying’ when lumber prices start to rise? If falling lumber prices and tighter credit conditions preceded a banking system crisis then wouldn’t it make sense to believe that rising lumber prices and easier credit is pointing towards a banking system recovery?
Our ongoing thought is that the divergence between the rally in the CRB Index and the ongoing weakness in the MTU/GLD ratio represents a significant markets opportunity. Our problem is that on any given day we aren’t sure whether this means collapsing commodity prices and stronger bonds or a weaker JGBs and a major rally in the Japanese banks.