Nov. 18 (Bloomberg) — Residential construction in the U.S. unexpectedly dropped in October amid concern a homebuyer tax credit would expire, illustrating the market’s dependence on government help to sustain a recovery as job losses mount.
Trends tend to develop far ahead of the news that eventually makes them obvious. In fact… a trend is often close to completion around the time that investors accept it as a given.
The problem this year is that the trends are somewhat confusing because, in large part, they are based on two conflicting themes. Asian or emerging markets strength pushes in one direction while U.S. or developed markets weakness pulls in the other. A trend with multiple personalities tends to create rather erratic daily action.
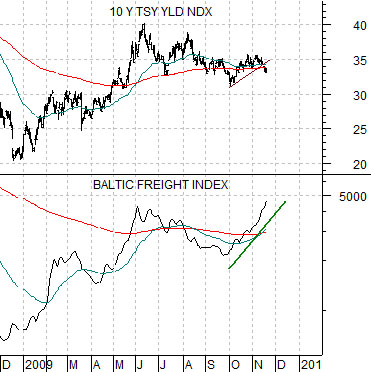
Below we compare 10-year U.S. Treasury yields and the Baltic Dry Index. The ongoing argument has been that dry bulk ocean freight rates represent the health of global trade as well as the momentum behind Asian economic activity. The stronger the trend for shipping rates the greater the upward pressure on long-term interest rates.
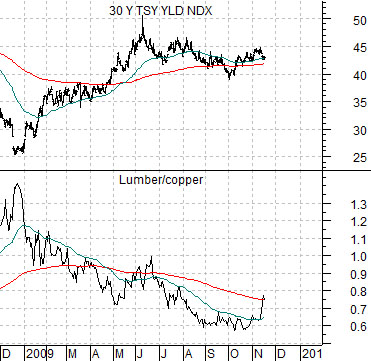
Below we compare 30-year U.S. Treasury yields with the ratio between lumber and copper futures.
In general our view is that copper represents Asian cyclical growth while lumber tends to do better when there is enough economic slack in the U.S. economy to allow for easier credit and lower interest rates.
The point that we are attempting to convey is that we can show two different charts with two very different messages. If we measure the trend for long-term yields off of ocean freight rates the conclusion is that interest rates are on the rise. If, on the other hand, we view the yields through the ratio of lumber to copper prices a rather clear case can be made that yields are just on the verge of declining.
In yesterday’s issue we tucked in the argument that the yield curve is close to as wide or steep as it is going to get. Over the coming months the spread between long-term and short-term U.S. interest rates will narrow but the question is… how will this take place? The Baltic Dry Index says that Asian growth will force short-term yields higher while the lumber/copper ratio argues that long-term yields are set to decline.
Equity/Bond Markets
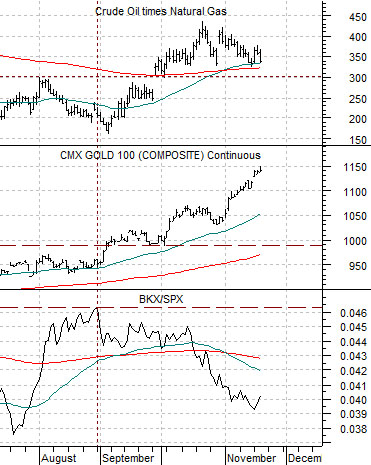
A few years back we ran a series of chart-based arguments focusing on the position of the product of crude oil times natural gas futures prices relative to ‘300’.
The idea was that when oil times gas is less than ‘300’ (i.e. something like 60 crude oil and 5 gas or 40 crude oil and 7.50 gas) the markets trade as if there is sufficient ‘slack’ in the system to support a rising trend for commodities such as lumber as well as the non-commodity growth sectors. In other words the rising trend for lumber prices began around the end of 2000 when ‘oil times gas’ fell back from 300 and continued all the way into 2004 when the product moved above 300. True or not, fair or not, that was the argument.
Below we show a comparison of crude oil times natural gas futures, gold futures, and the ratio of the Bank Index (BKX) to the S&P 500 Index (SPX).
One could argue, we suppose, that the link between the strength of the bank shares and gold prices rests with interest rates. As long as the banks remain under pressure the Fed will hold rates near 0% which, in turn, makes gold more attractive. Why? Because gold has no directly associated yield. If the yield on TBills is the same as the yield on gold (i.e. nothin’) then there is no penalty associated with holding gold.
Within the chart comparison the ‘crude oil times natural gas’ component represents the strength of cyclical growth. The stronger the trend for energy prices the greater the upward pressure on interest rates.
Gold prices, on the other hand, have been rising on U.S. dollar weakness but have also levered upwards when the BKX/SPX ratio has faltered. The push above 1000 for gold prices relates to the down turn in the BKX/SPX ratio around the end of August.
In a sense the markets have created a sort of self-fulfilling circle. Energy prices rise which puts pressure on the credit markets and this pressure serves to weaken off the bank shares. Stronger energy prices leading to weaker bank share prices.
We mentioned in yesterday’s issue that the basic argument behind rising energy prices is current emerging markets (Asian) demand and imminent developed country (U.S.) demand. Those long crude oil future are betting, in a sense, that Asian growth will pull U.S. growth higher while the bears would likely counter that once the impact of the various short-term stimulus packages fades… U.S. economic malaise will pull Asian growth lower.
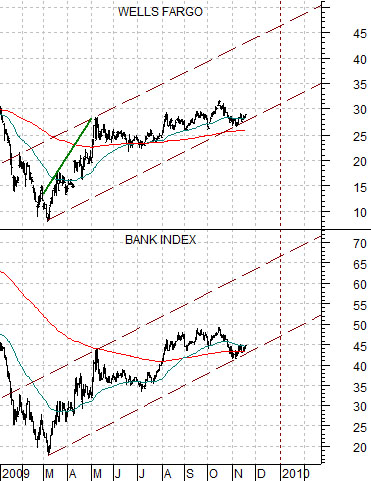
In any event… at right is a comparison between Wells Fargo (WFC) and the Bank Index (BKX). The channel lines drawn on the chart at completely arbitrary although they do represent our vision for the path of prices into 2010.
The point is that if the channel lines are drawn correctly then the banks are at or near support. If the banks hold channel support then the path of least resistance is higher and… if we get enough of a lift to push WFC from the channel bottom to the channel top- similar to March and April of this year then two things could happen. First, March/April were very strong equity markets months and second, between late February into April the price of gold fell from around 1000 back to 865.