

The Nasdaq has been trying to fill the gap between 4451 and 4459 for over a week. That gap zone is indicated on the chart with a purple rectangle.
That gap is acting as a magnet and I expect it to be filled this week (probably today). For this to happen, however, the Nasdaq would need to push through the Volume Profile Point of Control (VPPOC) at 4427. At the moment it looks capable of doing so.
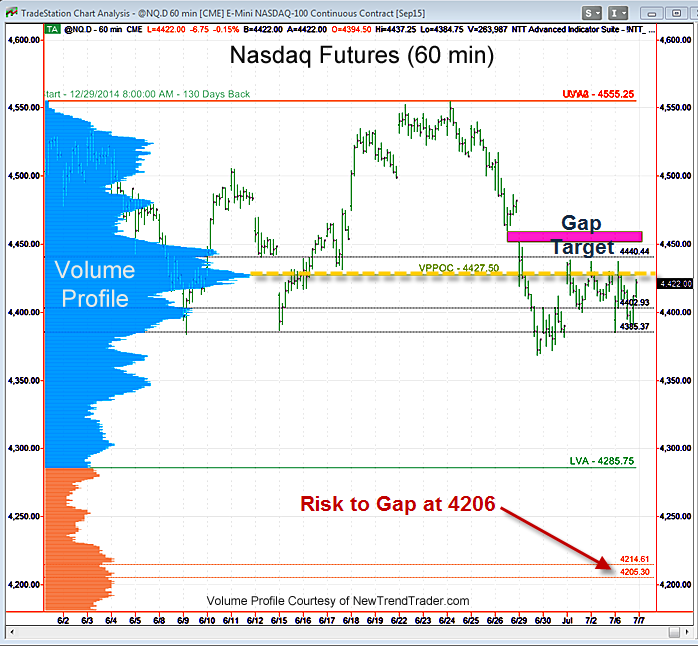
Then the question becomes, what about the gap at 4206? Admittedly, it is quite far away from the present action, but a deeper correction is certainly possible and would be quite healthy for the market.
As a tell, I suggest watching the Biotech index (IBB) for signs of weakness. So far, it is quite stable and if Biotech does not crack, a deeper correction will be postponed.
In regard to the bigger picture, the equity bull market is not likely to be complete until gold falls below $900 and we see some high volume capitulation among owners of the yellow metal.
A Note on Volume Profile
The histogram on the left side of the chart shows the volume distribution in the Nasdaq futures for different periods of time. Key support and resistance levels are indicated by the peaks and troughs. If you would like to receive a primer on using Volume Profile, please click here

