

Given that the Nasdaq has been in “gap-hunt mode” for more than a month, the closest gap is the proximal target. That gap zone is indicated on the chart with a purple rectangle and lies between 4451 and 4459.
Above that level the market has a High Volume Node (HVN) at 4480, indicated by the blue dotted line. That level should cap a moderate rally.
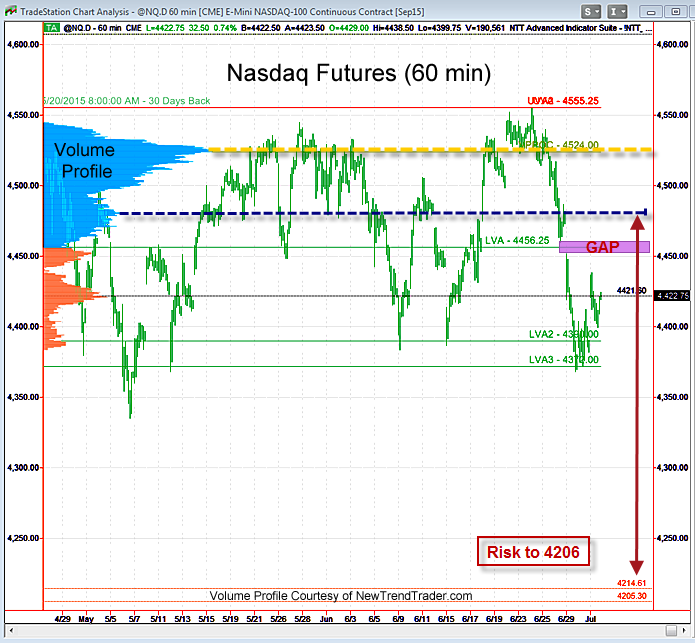
The real risk is to the downside once the upside gap is filled. There is little volume support below us down to the lower gap at 4206. If that level comes into play the index correction would be on the order of 5%.
That’s a typical corrective move, but it would be high drama in this bubbly environment where small-cap biotech names make new all-time highs every day. If biotech does not break, however, then the real correction will be postponed.
A Note on Volume Profile
The histogram on the left side of the chart shows the volume distribution in the Nasdaq futures for different periods of time. Key support and resistance levels are indicated by the peaks and troughs. If you would like to receive a primer on using Volume Profile, please click here

