
By: Fernando Gonzalez,EvolutionTrading.net, 8 November 2009
We have arrived at a special moment as US Stocks are now on the verge of having repaired half of the damage sustained in the ’07-’09 decline – the largest decline in the S&P500’s entire 50-year history. Not only has the market retraced back to the epicenter of that decline, as measured through PRICE levels, but we also arrive at its halfway point via measuring duration or TIME. Let’s take a look at the Equities in various time frames, and then later, let’s talk about GOLD:

Some readers might recognize the chart above from our newsletter several weeks ago, and S&P500 Monthly chart going back over 10 years, measuring the big decline’s Price (blue) and Time (purple) halfway points. The chart above is marked similarly as before, except that this time, the market now arrives at the 50% extension mark in TIME (delineated in purple). In the previous illustration, we also labeled the half-way point in Time with “Thanksgiving 2009.” In light of the overall technicals in addition to the one we have above, it is at or around this area that the market is likely to produce its largest correction since the March low point. While anticipating the extent of the correction (if and when there is one) is always difficult, a 20% magnitude at the minimum is not at all that far-fetched, considering the size of the preceding rally is over 60% for the S&P.
So far, US Equities peaked for the year in October and, depending on which major market measure you are looking at, the extent of corrections have varied, let’s take a look:
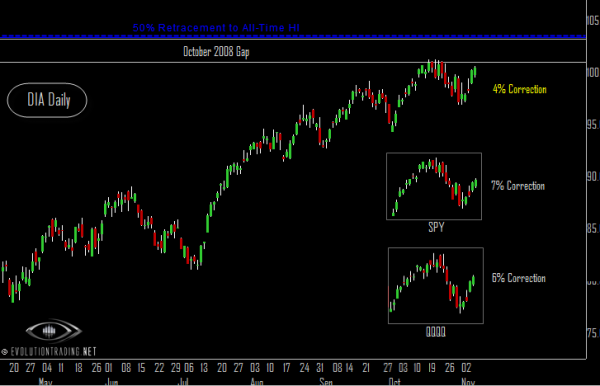
The chart above is a Daily chart of the DOW via the DIA. The little boxes show the S&P500 (via SPY) and Nasdaq (via QQQQ) that each illustrate the extent of their respective “corrections” from their highest points for the year. Notice that the S&P500’s correction, although very similar to Nasdaq, is almost twice that of the DOW’s. This is quite unusual, and it illustrates that much of the market’s strength is rooted in the DOW. Some may view this is undesirable in an uptrend, since the index with the least componentry (DOW) leads the way higher deep into a mature uptrend – a sign of deteriorating breadth.
Regardless, the shallow correction, followed by a strong comeback over the last few days illustrates a DOW that has plenty of momentum to move to new HI’s soon, and up into its October 2008, as well as closer to test its 50% Retracement (too All-Time HI, dotted blue line). If and when this were to occur, the technicals from our first our chart in this article will come into play. These are, no doubt, interesting times.
And speaking of interesting times, let’s take a look at GOLD, trading at or near historical highs:

Gold continues to make history in November, as it moves to new All-Time HI’s against the US dollar. In fact, as I write this, Gold has hit a momentum target we set several weeks ago at $1,100/oz. By “momentum target” we referred to its short-term breakout momentum, as it pushes through its former All-Time HI point of $1,032 in March 2008. As mentioned in the same article, our longer range target sits at approximately the $1,500 level. This may seem astronomical to some in light of where it is trading now. The target is derived through its Monthly scale trajectory and the expanding nature of trends, which we illustrate simply with the Blue dotted lines above. The window of time for the target is proportionally large as well, which we delineate above with the horizontal lines, marking the Spring of 2010 up to about 12 months later. Many, including ourselves, attempt to interpret what Gold’s price is trying to “say.” We can develop many plausible arguments in favor of one thing or another, but the undeniable fact remains that the “thing” which drives all markets we refer to as momentum – the very same that is driving Gold – is upward here, and therefore that momentum is likely to continue, until we see evidence of a larger force. At this point, that larger force that will stop Gold’s long-range momentum is nowhere to be seen.
© EvolutionTrading.net 2009

