

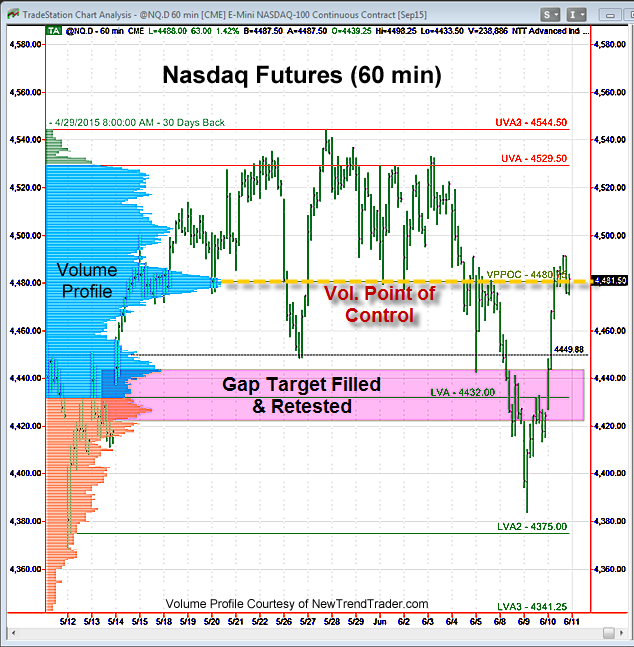
Wednesdays are often market reversal days. That was the case this week after the Nasdaq futures filled and completed a re-test of support at the large gap zone. The forecast was for a successful test of this zone and “a bounce back up to the Volume Profile Point of Control at 4487, a key S/R level we have referenced many times before.”
That process was completed at the end of the day on Wednesday. The Volume Profile Point of Control (VPPOC) is the price at which the most trades were executed over the look-back period, which in this chart is 30 days. It has moved a few points in the last two days and now stands at 4480.
This would be a good spot for the market to consolidate before attempting a move to new highs.
A Note on Volume Profile
The histogram on the left side of the chart shows the volume distribution in the Nasdaq futures for different periods of time. Key support and resistance levels are indicated by the peaks and troughs. If you would like to receive a primer on using Volume Profile, please click here.

